
Benchmark tools
LiteRT benchmark tools currently measure and calculate statistics for the following important performance metrics:
- Initialization time
- Inference time of warmup state
- Inference time of steady state
- Memory usage during initialization time
- Overall memory usage
The benchmark tools are available as benchmark apps for Android and iOS and as native command-line binaries, and they all share the same core performance measurement logic. Note that the available options and output formats are slightly different due to the differences in runtime environment.
Android benchmark app
There are two options of using the benchmark tool with Android. One is a native benchmark binary and another is an Android benchmark app, a better gauge of how the model would perform in the app. Either way, the numbers from the benchmark tool will still differ slightly from when running inference with the model in the actual app.
This Android benchmark app has no UI. Install and run it by using the adb
command and retrieve results by using the adb logcat command.
Download or build the app
Download the nightly pre-built Android benchmark apps using the links below:
As for Android benchmark apps that support TF ops via Flex delegate, use the links below:
You can also build the app from source by following these instructions.
Prepare benchmark
Before running the benchmark app, install the app and push the model file to the device as follows:
adb install -r -d -g android_aarch64_benchmark_model.apk
adb push your_model.tflite /data/local/tmp
Run benchmark
adb shell am start -S \
  -n org.tensorflow.lite.benchmark/.BenchmarkModelActivity \
  --es args '"--graph=/data/local/tmp/your_model.tflite \
              --num_threads=4"'
graph is a required parameter.
graph:string
The path to the TFLite model file.
You can specify more optional parameters for running the benchmark.
num_threads:int(default=1)
The number of threads to use for running TFLite interpreter.use_gpu:bool(default=false)
Use GPU delegate.use_xnnpack:bool(default=false)
Use XNNPACK delegate.
Depending on the device you are using, some of these options may not be available or have no effect. Refer to parameters for more performance parameters that you could run with the benchmark app.
View the results using the logcat command:
adb logcat | grep "Inference timings"
The benchmark results are reported as:
... tflite : Inference timings in us: Init: 5685, First inference: 18535, Warmup (avg): 14462.3, Inference (avg): 14575.2
Native benchmark binary
Benchmark tool is also provided as a native binary benchmark_model. You can
execute this tool from a shell command line on Linux, Mac, embedded devices and
Android devices.
Download or build the binary
Download the nightly pre-built native command-line binaries by following the links below:
As for nightly pre-built binaries that support TF ops via Flex delegate, use the links below:
You can also build the native benchmark binary from source on your computer.
bazel build -c opt //tensorflow/lite/tools/benchmark:benchmark_model
To build with Android NDK toolchain, you need to set up the build environment first by following this guide, or use the docker image as described in this guide.
bazel build -c opt --config=android_arm64 \
  //tensorflow/lite/tools/benchmark:benchmark_model
Run benchmark
To run benchmarks on your computer, execute the binary from the shell.
path/to/downloaded_or_built/benchmark_model \
  --graph=your_model.tflite \
  --num_threads=4
You can use the same set of parameters as mentioned above with the native command-line binary.
Profiling model ops
The benchmark model binary also allows you to profile model ops and get the
execution times of each operator. To do this, pass the flag
--enable_op_profiling=true to benchmark_model during invocation. Details are
explained
here.
Native benchmark binary for multiple performance options in a single run
A convenient and simple C++ binary is also provided to
benchmark multiple performance options
in a single run. This binary is built based on the aforementioned benchmark tool
that could only benchmark a single performance option at a time. They share the
same build/install/run process, but the BUILD target name of this binary is
benchmark_model_performance_options and it takes some additional parameters.
An important parameter for this binary is:
perf_options_list: string (default='all')
A comma-separated list of TFLite performance options to benchmark.
You can get nightly pre-built binaries for this tool as listed below:
iOS benchmark app
To run benchmarks on iOS device, you need to build the app from
source.
Put the LiteRT model file in the
benchmark_data
directory of the source tree and modify the benchmark_params.json file. Those
files are packaged into the app and the app reads data from the directory. Visit
the
iOS benchmark app
for detailed instructions.
Performance benchmarks for well known models
This section lists LiteRT performance benchmarks when running well known models on some Android and iOS devices.
Android performance benchmarks
These performance benchmark numbers were generated with the native benchmark binary.
For Android benchmarks, the CPU affinity is set to use big cores on the device to reduce variance (see details).
It assumes that models were downloaded and unzipped to the
/data/local/tmp/tflite_models directory. The benchmark binary is built using
these instructions
and assumed to be in the /data/local/tmp directory.
To run the benchmark:
adb shell /data/local/tmp/benchmark_model \
  --num_threads=4 \
  --graph=/data/local/tmp/tflite_models/${GRAPH} \
  --warmup_runs=1 \
  --num_runs=50
To run with GPU delegate, set --use_gpu=true.
The performance values below are measured on Android 10.
| Model Name | Device | CPU, 4 threads | GPU |
|---|---|---|---|
| Mobilenet_1.0_224(float) | Pixel 3 | 23.9 ms | 6.45 ms |
| Pixel 4 | 14.0 ms | 9.0 ms | |
| Mobilenet_1.0_224 (quant) | Pixel 3 | 13.4 ms | --- |
| Pixel 4 | 5.0 ms | --- | |
| NASNet mobile | Pixel 3 | 56 ms | --- |
| Pixel 4 | 34.5 ms | --- | |
| SqueezeNet | Pixel 3 | 35.8 ms | 9.5 ms |
| Pixel 4 | 23.9 ms | 11.1 ms | |
| Inception_ResNet_V2 | Pixel 3 | 422 ms | 99.8 ms |
| Pixel 4 | 272.6 ms | 87.2 ms | |
| Inception_V4 | Pixel 3 | 486 ms | 93 ms |
| Pixel 4 | 324.1 ms | 97.6 ms |
iOS performance benchmarks
These performance benchmark numbers were generated with the iOS benchmark app.
To run iOS benchmarks, the benchmark app was modified to include the appropriate
model and benchmark_params.json was modified to set num_threads to 2. To use
the GPU delegate, "use_gpu" : "1" and "gpu_wait_type" : "aggressive" options
were also added to benchmark_params.json.
| Model Name | Device | CPU, 2 threads | GPU |
|---|---|---|---|
| Mobilenet_1.0_224(float) | iPhone XS | 14.8 ms | 3.4 ms |
| Mobilenet_1.0_224 (quant) | iPhone XS | 11 ms | --- |
| NASNet mobile | iPhone XS | 30.4 ms | --- |
| SqueezeNet | iPhone XS | 21.1 ms | 15.5 ms |
| Inception_ResNet_V2 | iPhone XS | 261.1 ms | 45.7 ms |
| Inception_V4 | iPhone XS | 309 ms | 54.4 ms |
Trace LiteRT internals
Trace LiteRT internals in Android
Internal events from the LiteRT interpreter of an Android app can be captured by Android tracing tools. They are the same events with Android Trace API, so the captured events from Java/Kotlin code are seen together with LiteRT internal events.
Some examples of events are:
- Operator invocation
- Graph modification by delegate
- Tensor allocation
Among different options for capturing traces, this guide covers the Android Studio CPU Profiler and the System Tracing app. Refer to Perfetto command-line tool or Systrace command-line tool for other options.
Adding trace events in Java code
This is a code snippet from the
Image Classification
example app. LiteRT interpreter runs in the
recognizeImage/runInference section. This step is optional but it is useful to
help notice where the inference call is made.
  Trace.beginSection("recognizeImage");
  ...
  // Runs the inference call.
  Trace.beginSection("runInference");
  tflite.run(inputImageBuffer.getBuffer(), outputProbabilityBuffer.getBuffer().rewind());
  Trace.endSection();
  ...
  Trace.endSection();
Enable LiteRT tracing
To enable LiteRT tracing, set the Android system property
debug.tflite.trace to 1 before starting the Android app.
adb shell setprop debug.tflite.trace 1
If this property has been set when LiteRT interpreter is initialized, key events (e.g., operator invocation) from the interpreter will be traced.
After you captured all the traces, disable tracing by setting the property value to 0.
adb shell setprop debug.tflite.trace 0
Android Studio CPU Profiler
Capture traces with the Android Studio CPU Profiler by following the steps below:
Select Run > Profile 'app' from the top menus.
Click anywhere in CPU timeline when the Profiler window appears.
Select 'Trace System Calls' among CPU Profiling modes.
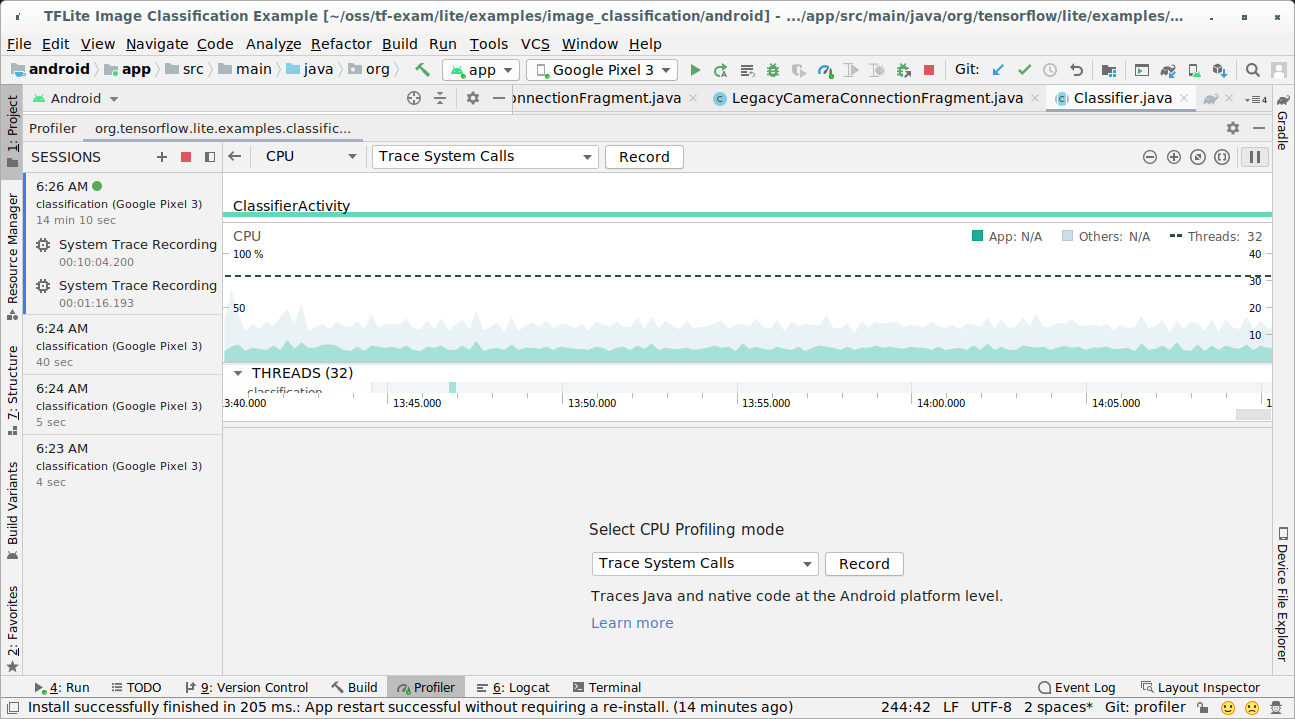
Press 'Record' button.
Press 'Stop' button.
Investigate the trace result.
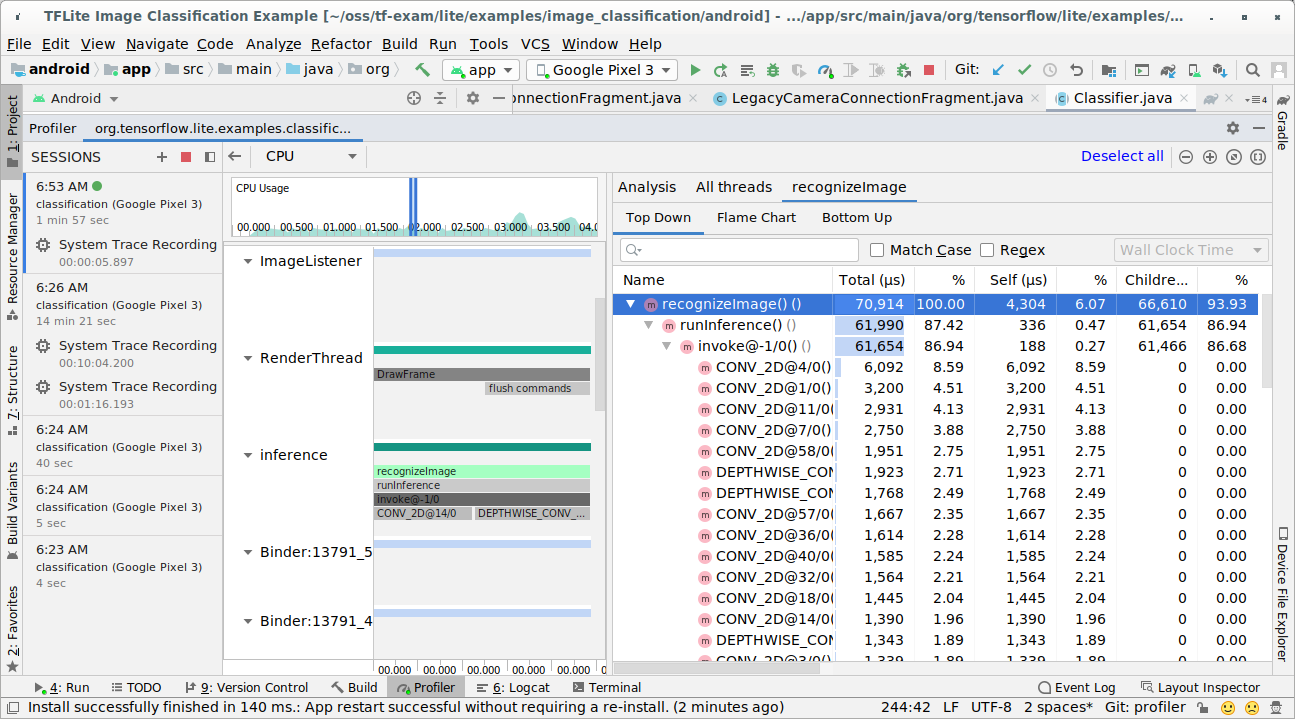
In this example, you can see the hierarchy of events in a thread and statistics for each operator time and also see the data flow of the whole app among threads.
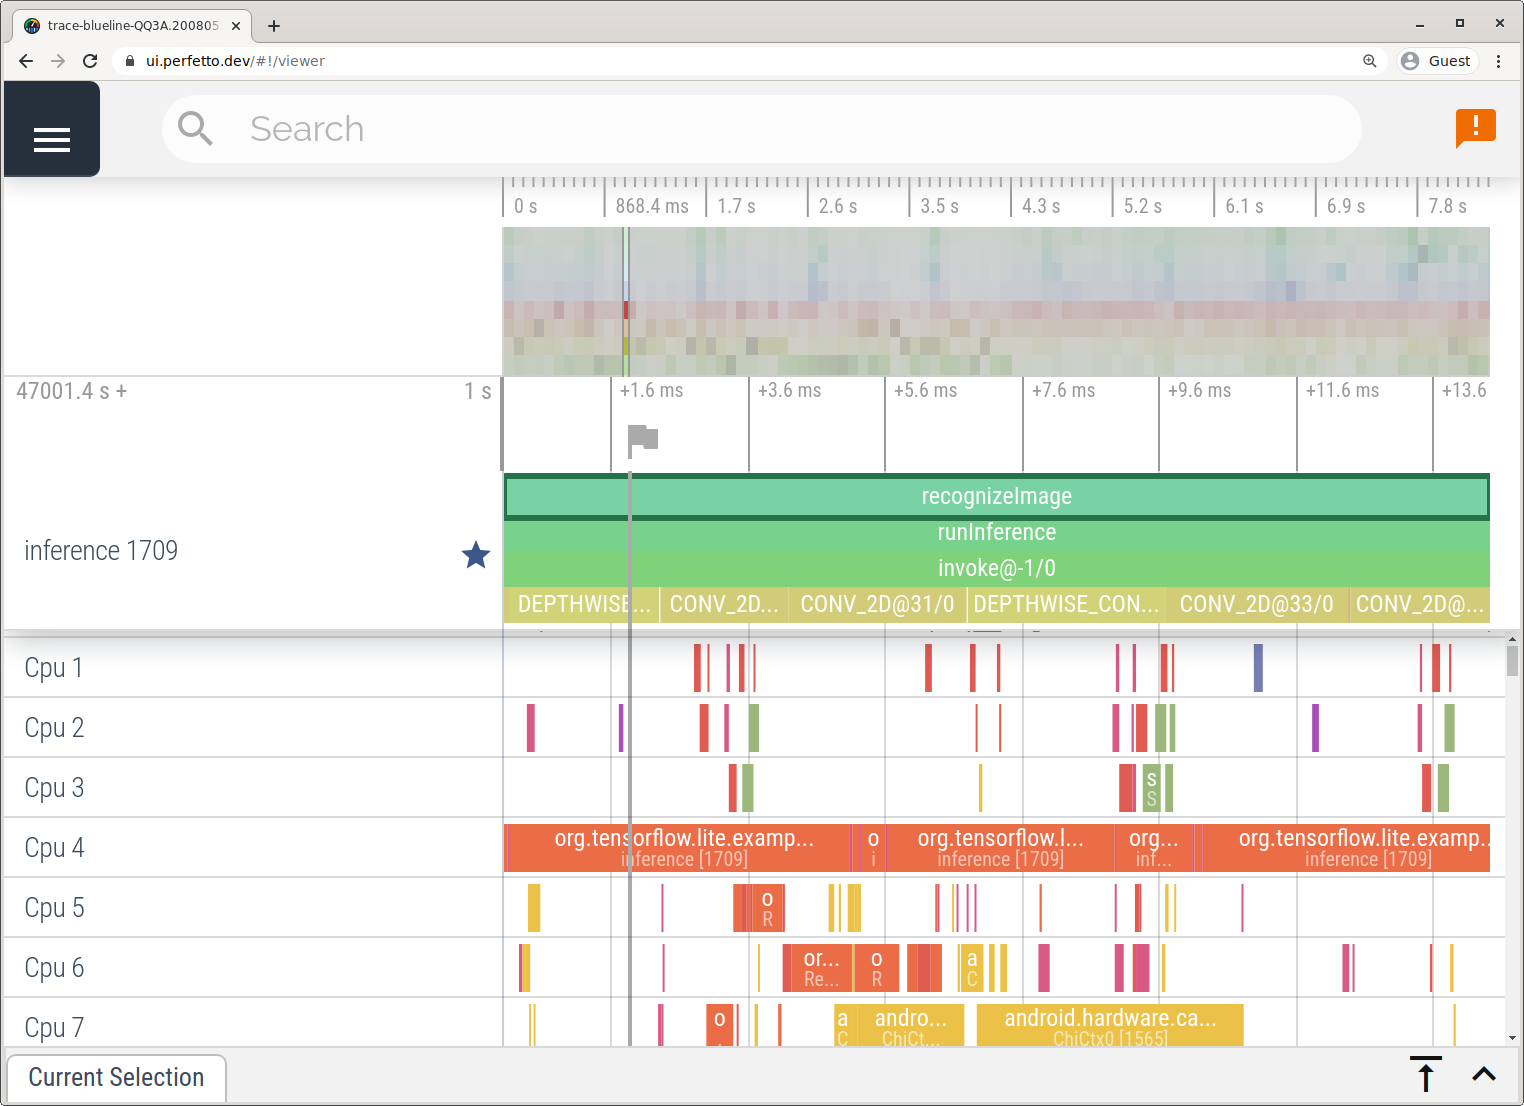
System Tracing app
Capture traces without Android Studio by following the steps detailed in System Tracing app.
In this example, the same TFLite events were captured and saved to the Perfetto or Systrace format depending on the version of Android device. The captured trace files can be opened in the Perfetto UI.
Trace LiteRT internals in iOS
Internal events from the LiteRT interpreter of an iOS app can be captured by Instruments tool included with Xcode. They are the iOS signpost events, so the captured events from Swift/Objective-C code are seen together with LiteRT internal events.
Some examples of events are:
- Operator invocation
- Graph modification by delegate
- Tensor allocation
Enable LiteRT tracing
Set the environment variable debug.tflite.trace by following the steps below:
Select Product > Scheme > Edit Scheme... from the top menus of Xcode.
Click 'Profile' in the left pane.
Deselect 'Use the Run action's arguments and environment variables' checkbox.
Add
debug.tflite.traceunder 'Environment Variables' section.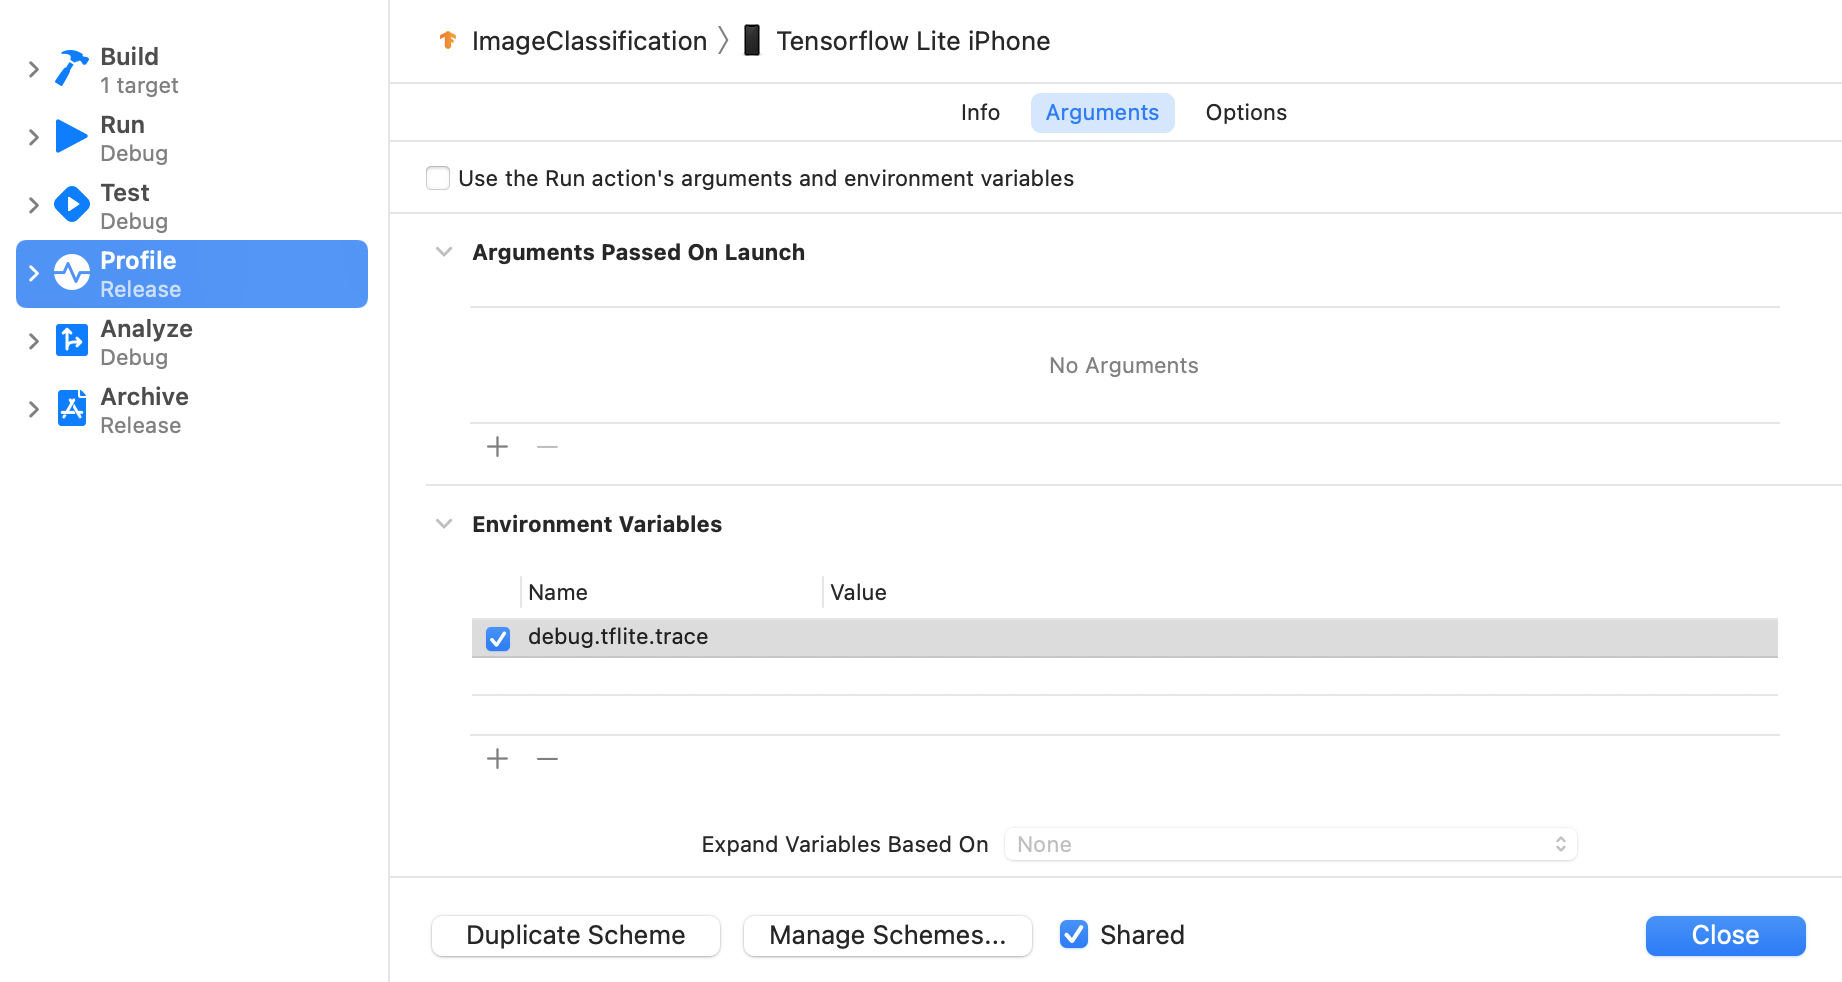
If you want to exclude LiteRT events when profiling the iOS app, disable tracing by removing the environment variable.
XCode Instruments
Capture traces by following the steps below:
Select Product > Profile from the top menus of Xcode.
Click Logging among profiling templates when Instruments tool launches.
Press 'Start' button.
Press 'Stop' button.
Click 'os_signpost' to expand OS Logging subsystem items.
Click 'org.tensorflow.lite' OS Logging subsystem.
Investigate the trace result.
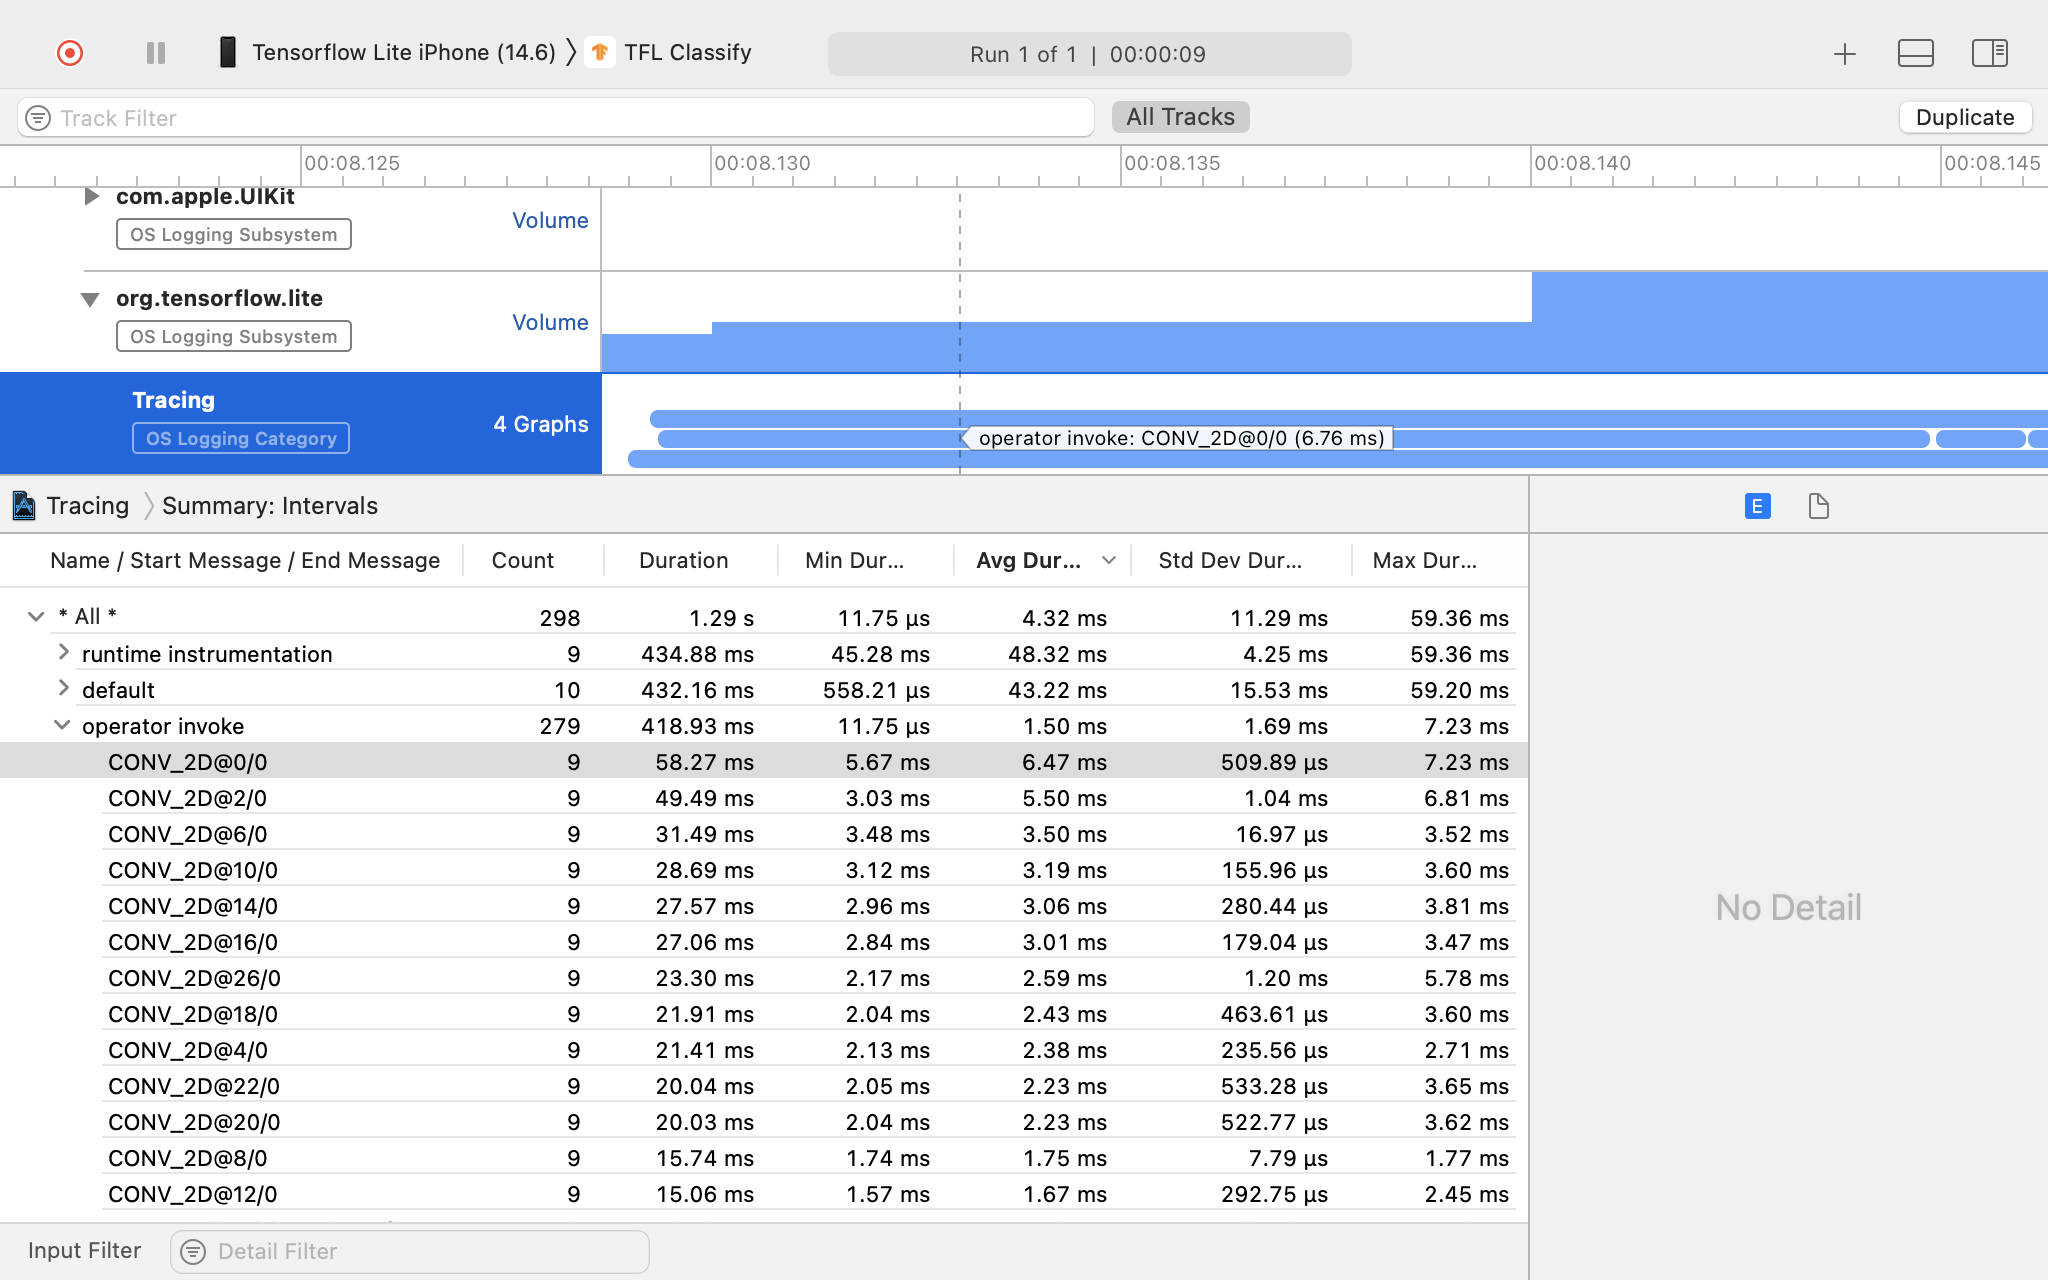
In this example, you can see the hierarchy of events and statistics for each operator time.
Using the tracing data
The tracing data allows you to identify performance bottlenecks.
Here are some examples of insights that you can get from the profiler and potential solutions to improve performance:
- If the number of available CPU cores is smaller than the number of inference threads, then the CPU scheduling overhead can lead to subpar performance. You can reschedule other CPU intensive tasks in your application to avoid overlapping with your model inference or tweak the number of interpreter threads.
- If the operators are not fully delegated, then some parts of the model graph are executed on the CPU rather than the expected hardware accelerator. You can substitute the unsupported operators with similar supported operators.