
| |
|
 在 GitHub 上查看源代码 在 GitHub 上查看源代码 |
|
总览
机器学习算法的计算开销通常很高。因此,量化机器学习应用的性能以确保您运行最优化版本的模型至关重要。使用 TensorFlow Profiler 可以剖析 TensorFlow 代码的执行情况。
设置
from datetime import datetime
from packaging import version

import os
TensorFlow Profiler 需要最新版本的 TensorFlow 和 TensorBoard (>=2.2)。
pip install -U tensorboard_plugin_profileimport tensorflow as tf
print("TensorFlow version: ", tf.__version__)
TensorFlow version: 2.2.0-dev20200405
确认 TensorFlow 可以获取 GPU。
device_name = tf.test.gpu_device_name()
if not device_name:
  raise SystemError('GPU device not found')
print('Found GPU at: {}'.format(device_name))
Found GPU at: /device:GPU:0
使用 TensorBoard 回调训练图像分类模型
在本教程中,您将通过捕获借助训练模型对 MNIST 数据集中的图像进行分类而获得的性能概况来探索 TensorFlow Profiler 的功能。
使用 TensorFlow 数据集导入训练数据并将其拆分为训练集和测试集。
import tensorflow_datasets as tfds
tfds.disable_progress_bar()
(ds_train, ds_test), ds_info = tfds.load(
    'mnist',
    split=['train', 'test'],
    shuffle_files=True,
    as_supervised=True,
    with_info=True,
)
WARNING:absl:Dataset mnist is hosted on GCS. It will automatically be downloaded to your
local data directory. If you'd instead prefer to read directly from our public
GCS bucket (recommended if you're running on GCP), you can instead set
data_dir=gs://tfds-data/datasets.
Downloading and preparing dataset mnist/3.0.0 (download: 11.06 MiB, generated: Unknown size, total: 11.06 MiB) to /root/tensorflow_datasets/mnist/3.0.0...
Dataset mnist downloaded and prepared to /root/tensorflow_datasets/mnist/3.0.0. Subsequent calls will reuse this data.
通过将像素值归一化为 0 和 1 之间的值来预处理训练数据和测试数据。
def normalize_img(image, label):
  """Normalizes images: `uint8` -> `float32`."""
  return tf.cast(image, tf.float32) / 255., label

ds_train = ds_train.map(normalize_img)
ds_train = ds_train.batch(128)
ds_test = ds_test.map(normalize_img)
ds_test = ds_test.batch(128)
使用 Keras 创建图像分类模型。
model = tf.keras.models.Sequential([
  tf.keras.layers.Flatten(input_shape=(28, 28, 1)),
  tf.keras.layers.Dense(128,activation='relu'),
  tf.keras.layers.Dense(10, activation='softmax')
])
model.compile(
    loss='sparse_categorical_crossentropy',
    optimizer=tf.keras.optimizers.Adam(0.001),
    metrics=['accuracy']
)
创建一个 TensorBoard 回调来捕获性能概况并在训练模型时调用它。
# Create a TensorBoard callback
logs = "logs/" + datetime.now().strftime("%Y%m%d-%H%M%S")

tboard_callback = tf.keras.callbacks.TensorBoard(log_dir = logs,
                                                 histogram_freq = 1,
                                                 profile_batch = '500,520')

model.fit(ds_train,
          epochs=2,
          validation_data=ds_test,
          callbacks = [tboard_callback])
Epoch 1/2
469/469 [==============================] - 11s 22ms/step - loss: 0.3684 - accuracy: 0.8981 - val_loss: 0.1971 - val_accuracy: 0.9436
Epoch 2/2
 50/469 [==>...........................] - ETA: 9s - loss: 0.2014 - accuracy: 0.9439WARNING:tensorflow:From /usr/local/lib/python3.6/dist-packages/tensorflow/python/ops/summary_ops_v2.py:1271: stop (from tensorflow.python.eager.profiler) is deprecated and will be removed after 2020-07-01.
Instructions for updating:
use `tf.profiler.experimental.stop` instead.
WARNING:tensorflow:From /usr/local/lib/python3.6/dist-packages/tensorflow/python/ops/summary_ops_v2.py:1271: stop (from tensorflow.python.eager.profiler) is deprecated and will be removed after 2020-07-01.
Instructions for updating:
use `tf.profiler.experimental.stop` instead.
469/469 [==============================] - 11s 24ms/step - loss: 0.1685 - accuracy: 0.9525 - val_loss: 0.1376 - val_accuracy: 0.9595
<tensorflow.python.keras.callbacks.History at 0x7f23919a6a58>
使用 TensorFlow Profiler 剖析模型训练性能
TensorFlow Profiler 嵌入到 TensorBoard 中。使用 Colab 魔法加载 TensorBoard 并启动它。导航到 Profile 标签页可以查看性能概况。
# Load the TensorBoard notebook extension.
%load_ext tensorboard
此模型的性能概况类似于下图。
# Launch TensorBoard and navigate to the Profile tab to view performance profile
%tensorboard --logdir=logs
<IPython.core.display.Javascript object>
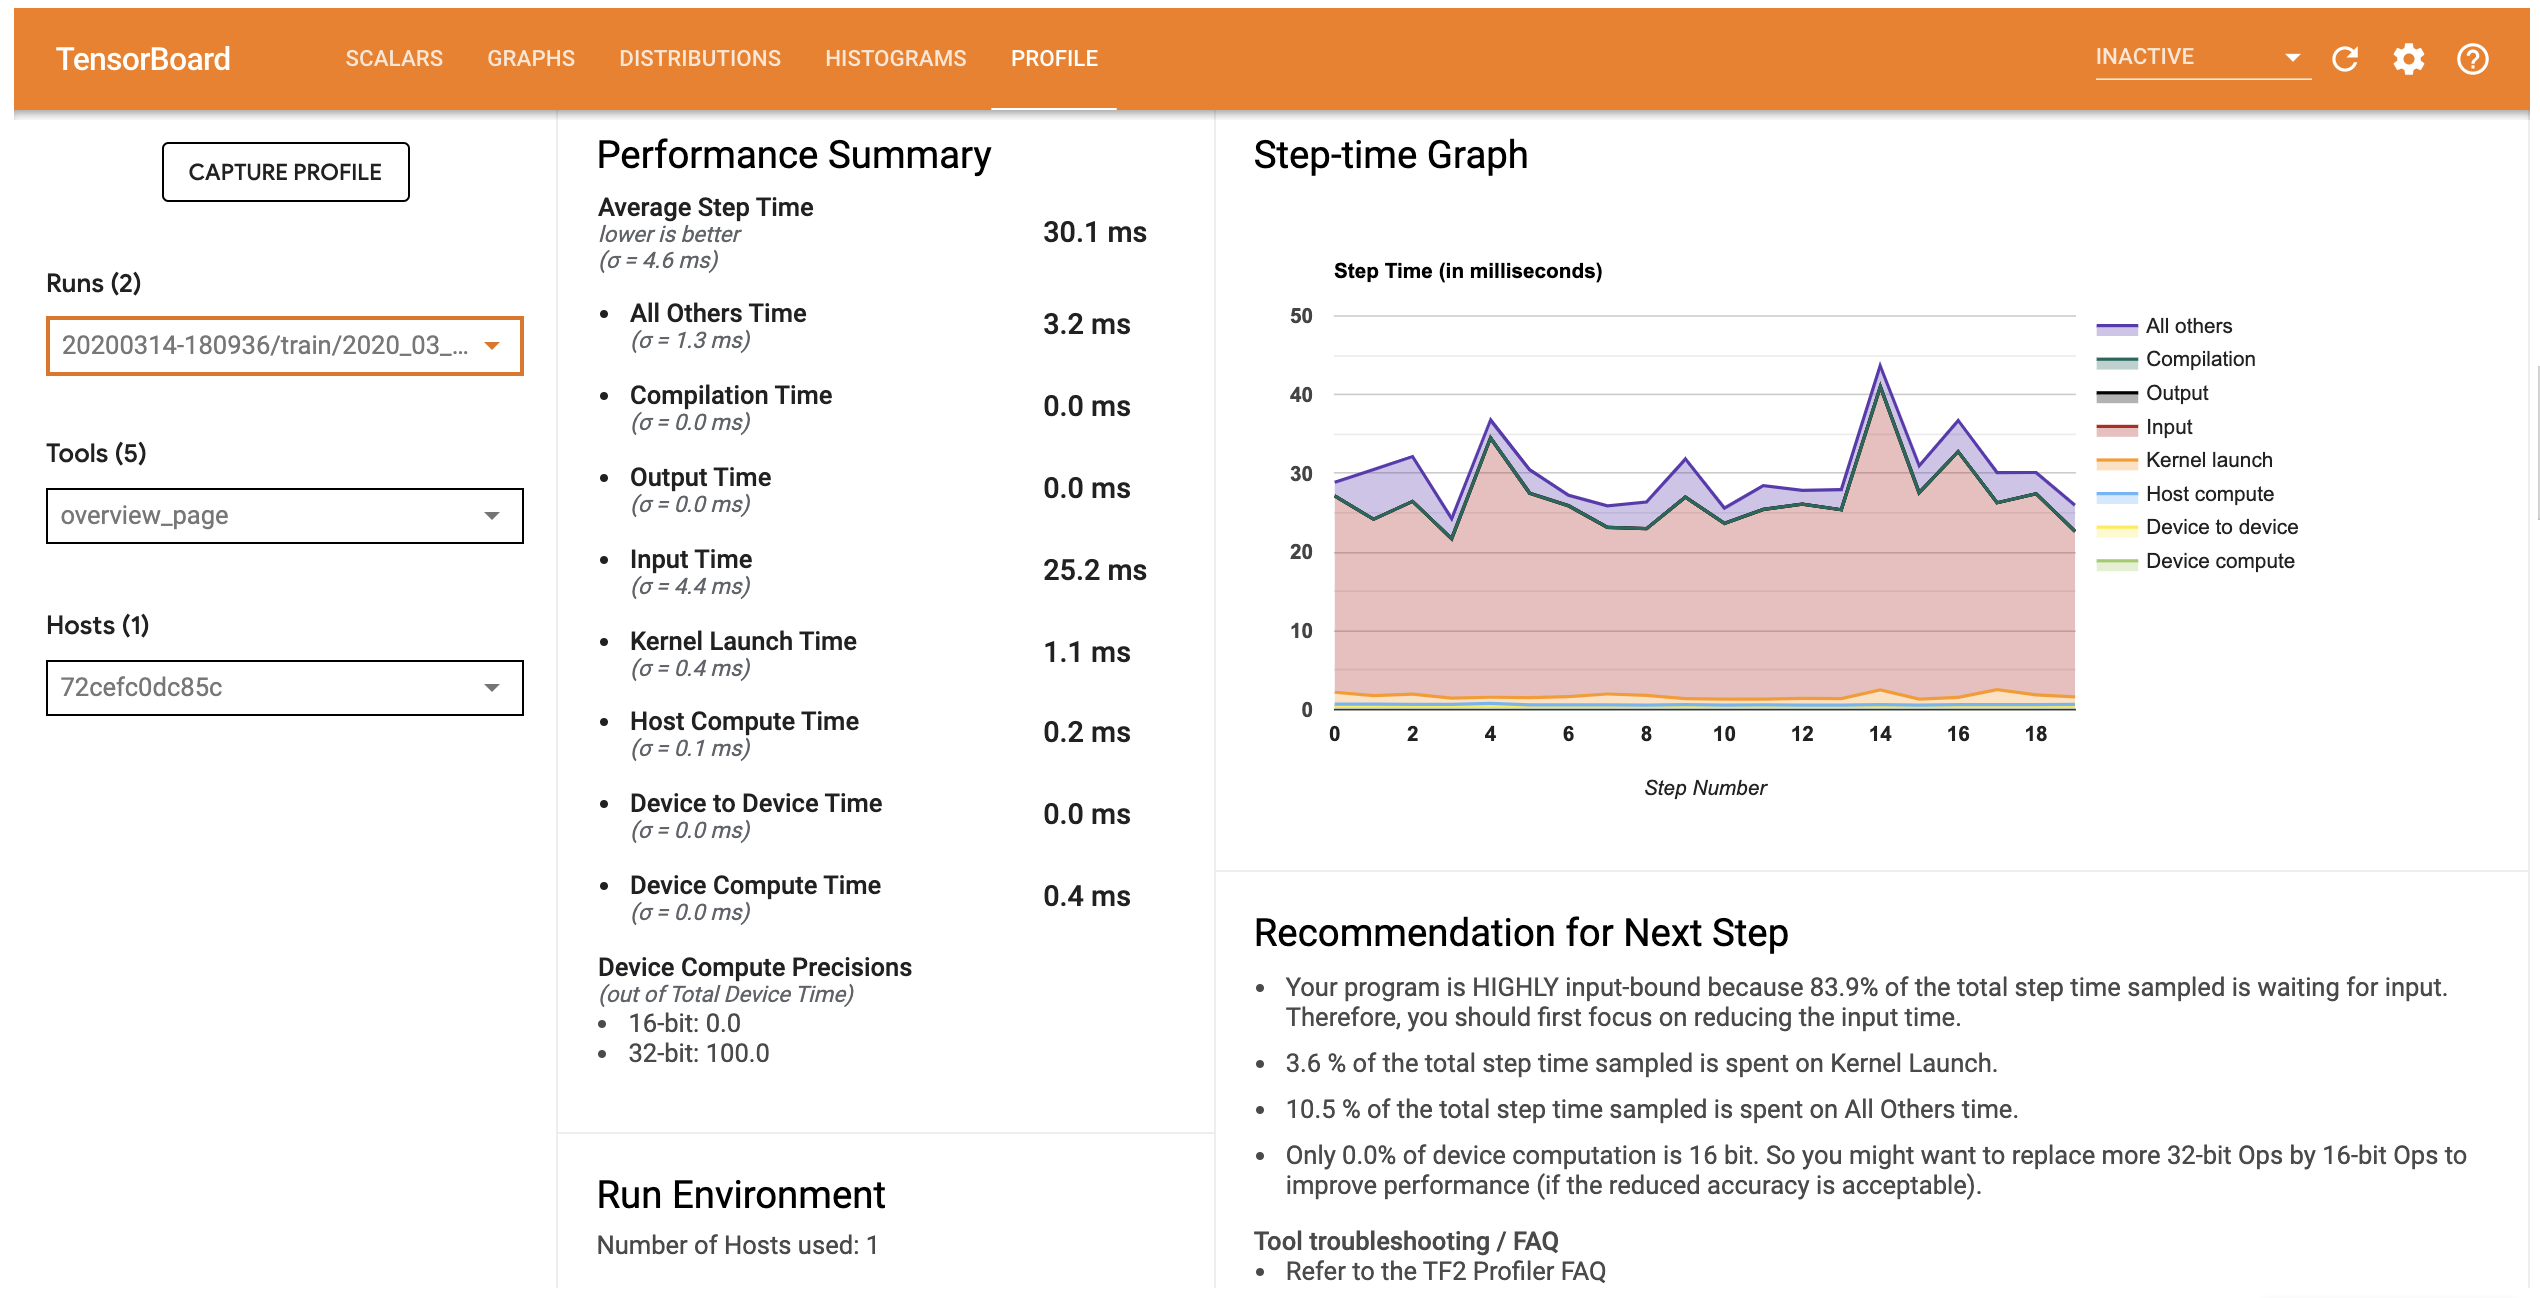
Profile 标签页会打开 Overview 页面,此页面可显示模型性能的高级摘要。查看右侧的 Step-time Graph,您可以看到该模型高度受输入约束(即,它在数据输入流水线中花费了大量时间)。此外,Overview 页面还为您提供了有关可用于优化模型性能的潜在后续措施的建议。
要了解输入流水线中出现性能瓶颈的位置,请从左侧的 Tools 下拉列表中选择 Trace Viewer。Trace Viewer 会显示性能剖析期间 CPU 和 GPU 上发生的不同事件的时间线。
Trace Viewer 在纵轴上显示多个事件组。每个事件组都有多个水平轨迹,其中填满了跟踪事件。轨迹是在线程或 GPU 流上执行的事件的事件时间线。各个事件是时间线轨迹上的彩色矩形块。时间从左向右移动。使用键盘快捷键 W(放大)、S(缩小)、A(向左滚动)和 D(向右滚动)可以导航跟踪事件。
单个矩形表示跟踪事件。选择浮动工具栏中的鼠标光标图标(或使用键盘快捷键 1),然后点击跟踪事件即可对其进行分析。这将显示有关事件的信息,例如开始时间和持续时间。
除了点击之外,您还可以拖动鼠标来选择一组跟踪事件。这将为您提供该区域所有事件的列表以及事件摘要。使用 M 键可以测量所选事件的持续时间。
跟踪事件的收集来源为:
- CPU:CPU 事件显示在名为
/host:CPU的事件组下。每个轨迹代表 CPU 上的一个线程。 CPU 事件包括输入流水线事件、GPU 运算调度事件、CPU 运算执行事件等。 - GPU:GPU 事件显示在以
/device:GPU:为前缀的事件组下。每个事件组代表 GPU 上的一个流。
调试性能瓶颈
使用 Trace Viewer 可以定位输入流水线中的性能瓶颈。下图是性能概况的快照。
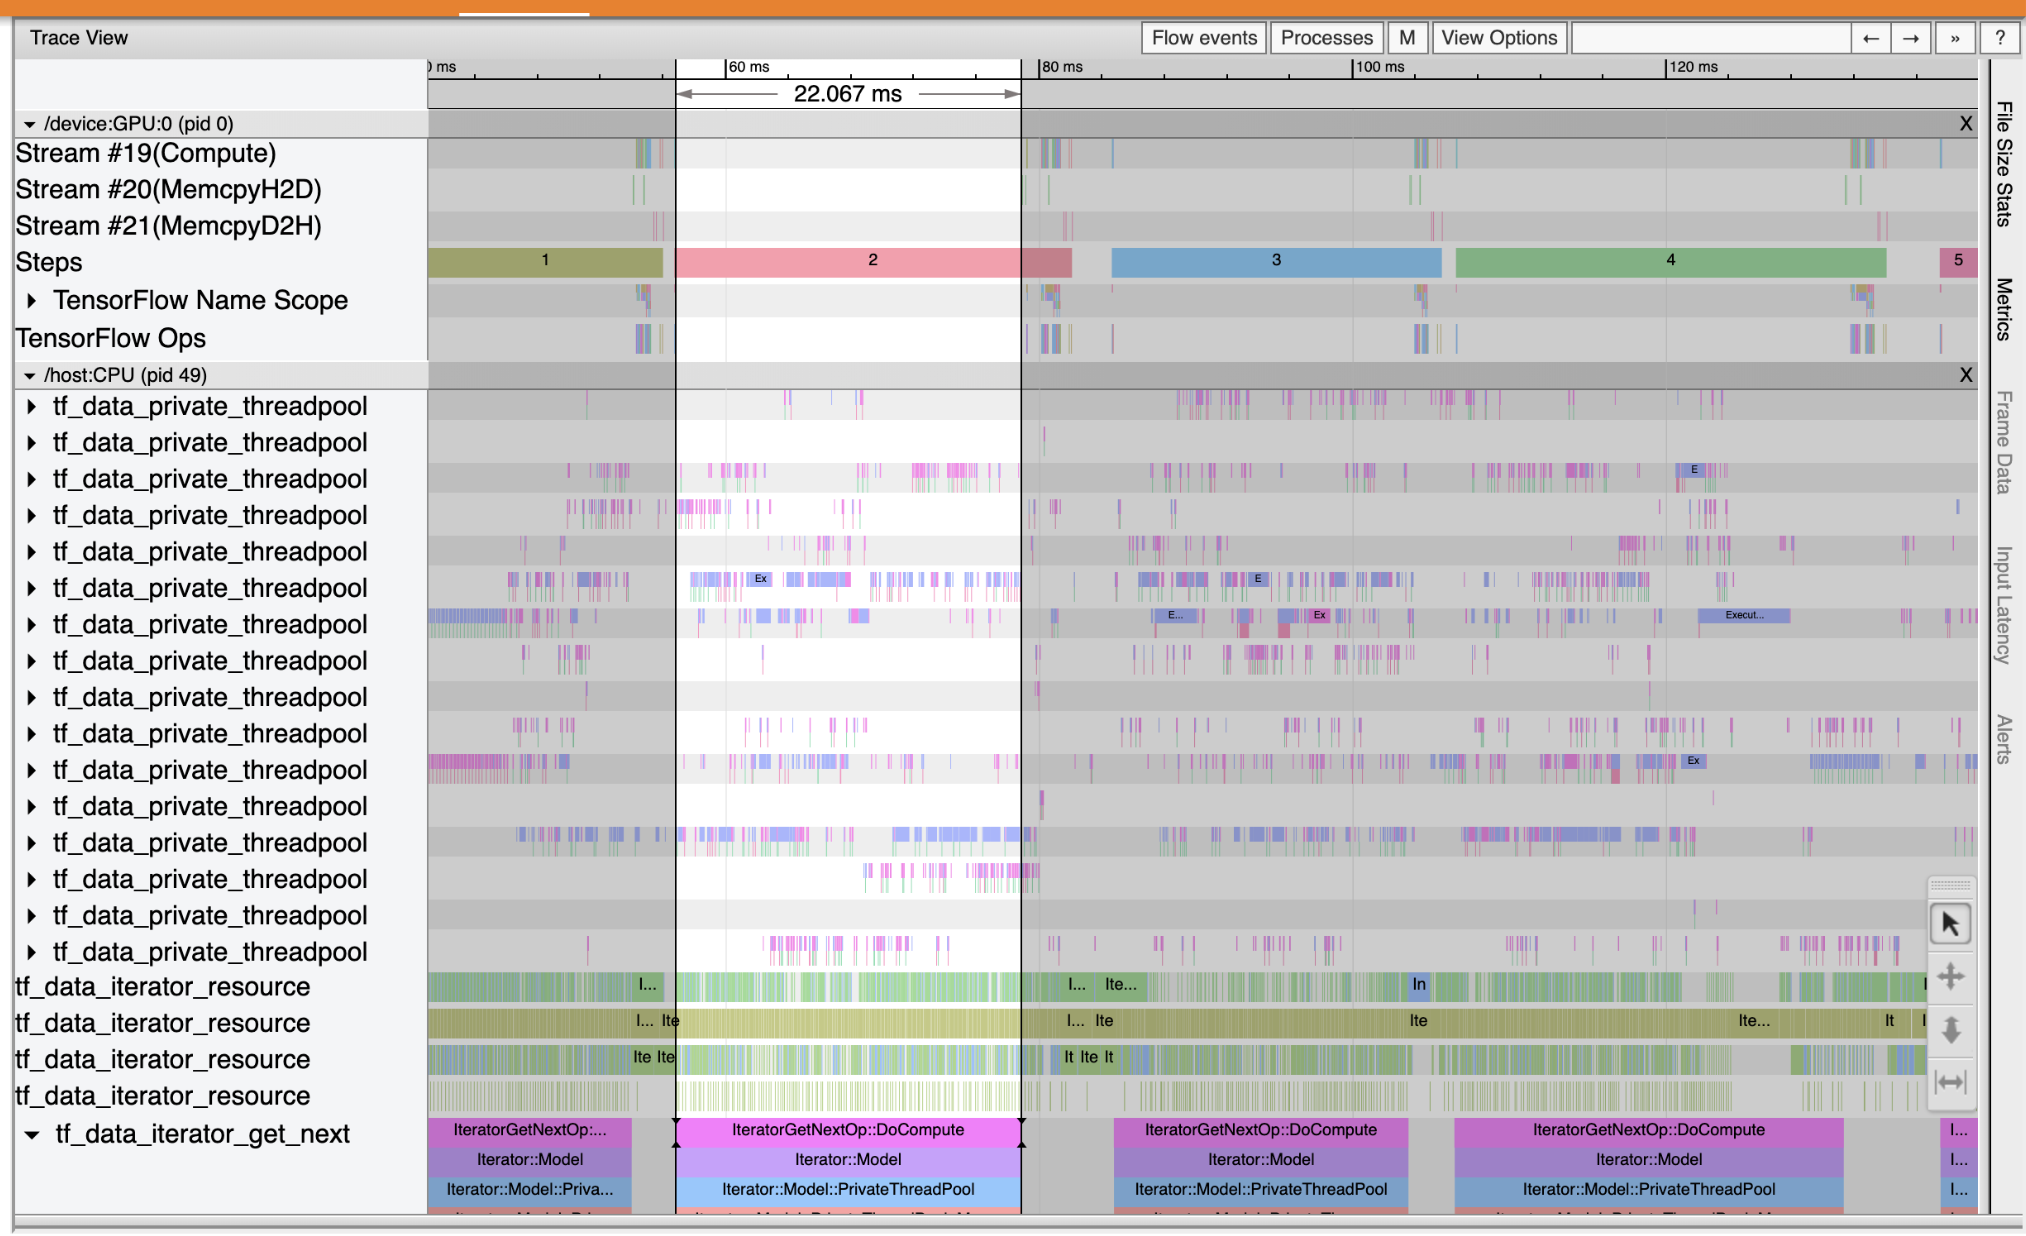
查看事件跟踪,您可以看到 GPU 处于非活动状态,而 tf_data_iterator_get_next 运算正在 CPU 上运行。此运算负责处理输入数据并将其发送到 GPU 进行训练。根据一般经验法则,最好让设备 (GPU/TPU) 始终保持活动状态。
使用 tf.data API 可以优化输入流水线。在这种情况下,我们缓存训练数据集并预提取数据以确保始终有数据可供 GPU 处理。有关使用 tf.data 优化输入流水线的详情,请参阅此处。
(ds_train, ds_test), ds_info = tfds.load(
    'mnist',
    split=['train', 'test'],
    shuffle_files=True,
    as_supervised=True,
    with_info=True,
)
ds_train = ds_train.map(normalize_img)
ds_train = ds_train.batch(128)
ds_train = ds_train.cache()
ds_train = ds_train.prefetch(tf.data.experimental.AUTOTUNE)
ds_test = ds_test.map(normalize_img)
ds_test = ds_test.batch(128)
ds_test = ds_test.cache()
ds_test = ds_test.prefetch(tf.data.experimental.AUTOTUNE)
再次训练模型并通过重用之前的回调来捕获性能概况。
model.fit(ds_train,
          epochs=2,
          validation_data=ds_test,
          callbacks = [tboard_callback])
Epoch 1/2
469/469 [==============================] - 10s 22ms/step - loss: 0.1194 - accuracy: 0.9658 - val_loss: 0.1116 - val_accuracy: 0.9680
Epoch 2/2
469/469 [==============================] - 1s 3ms/step - loss: 0.0918 - accuracy: 0.9740 - val_loss: 0.0979 - val_accuracy: 0.9712
<tensorflow.python.keras.callbacks.History at 0x7f23908762b0>
重新启动 TensorBoard 并打开 Profile 标签页以观察更新后的输入流水线的性能概况。
具有优化输入流水线的模型的性能概况类似于下图。
%tensorboard --logdir=logs
Reusing TensorBoard on port 6006 (pid 750), started 0:00:12 ago. (Use '!kill 750' to kill it.)
<IPython.core.display.Javascript object>
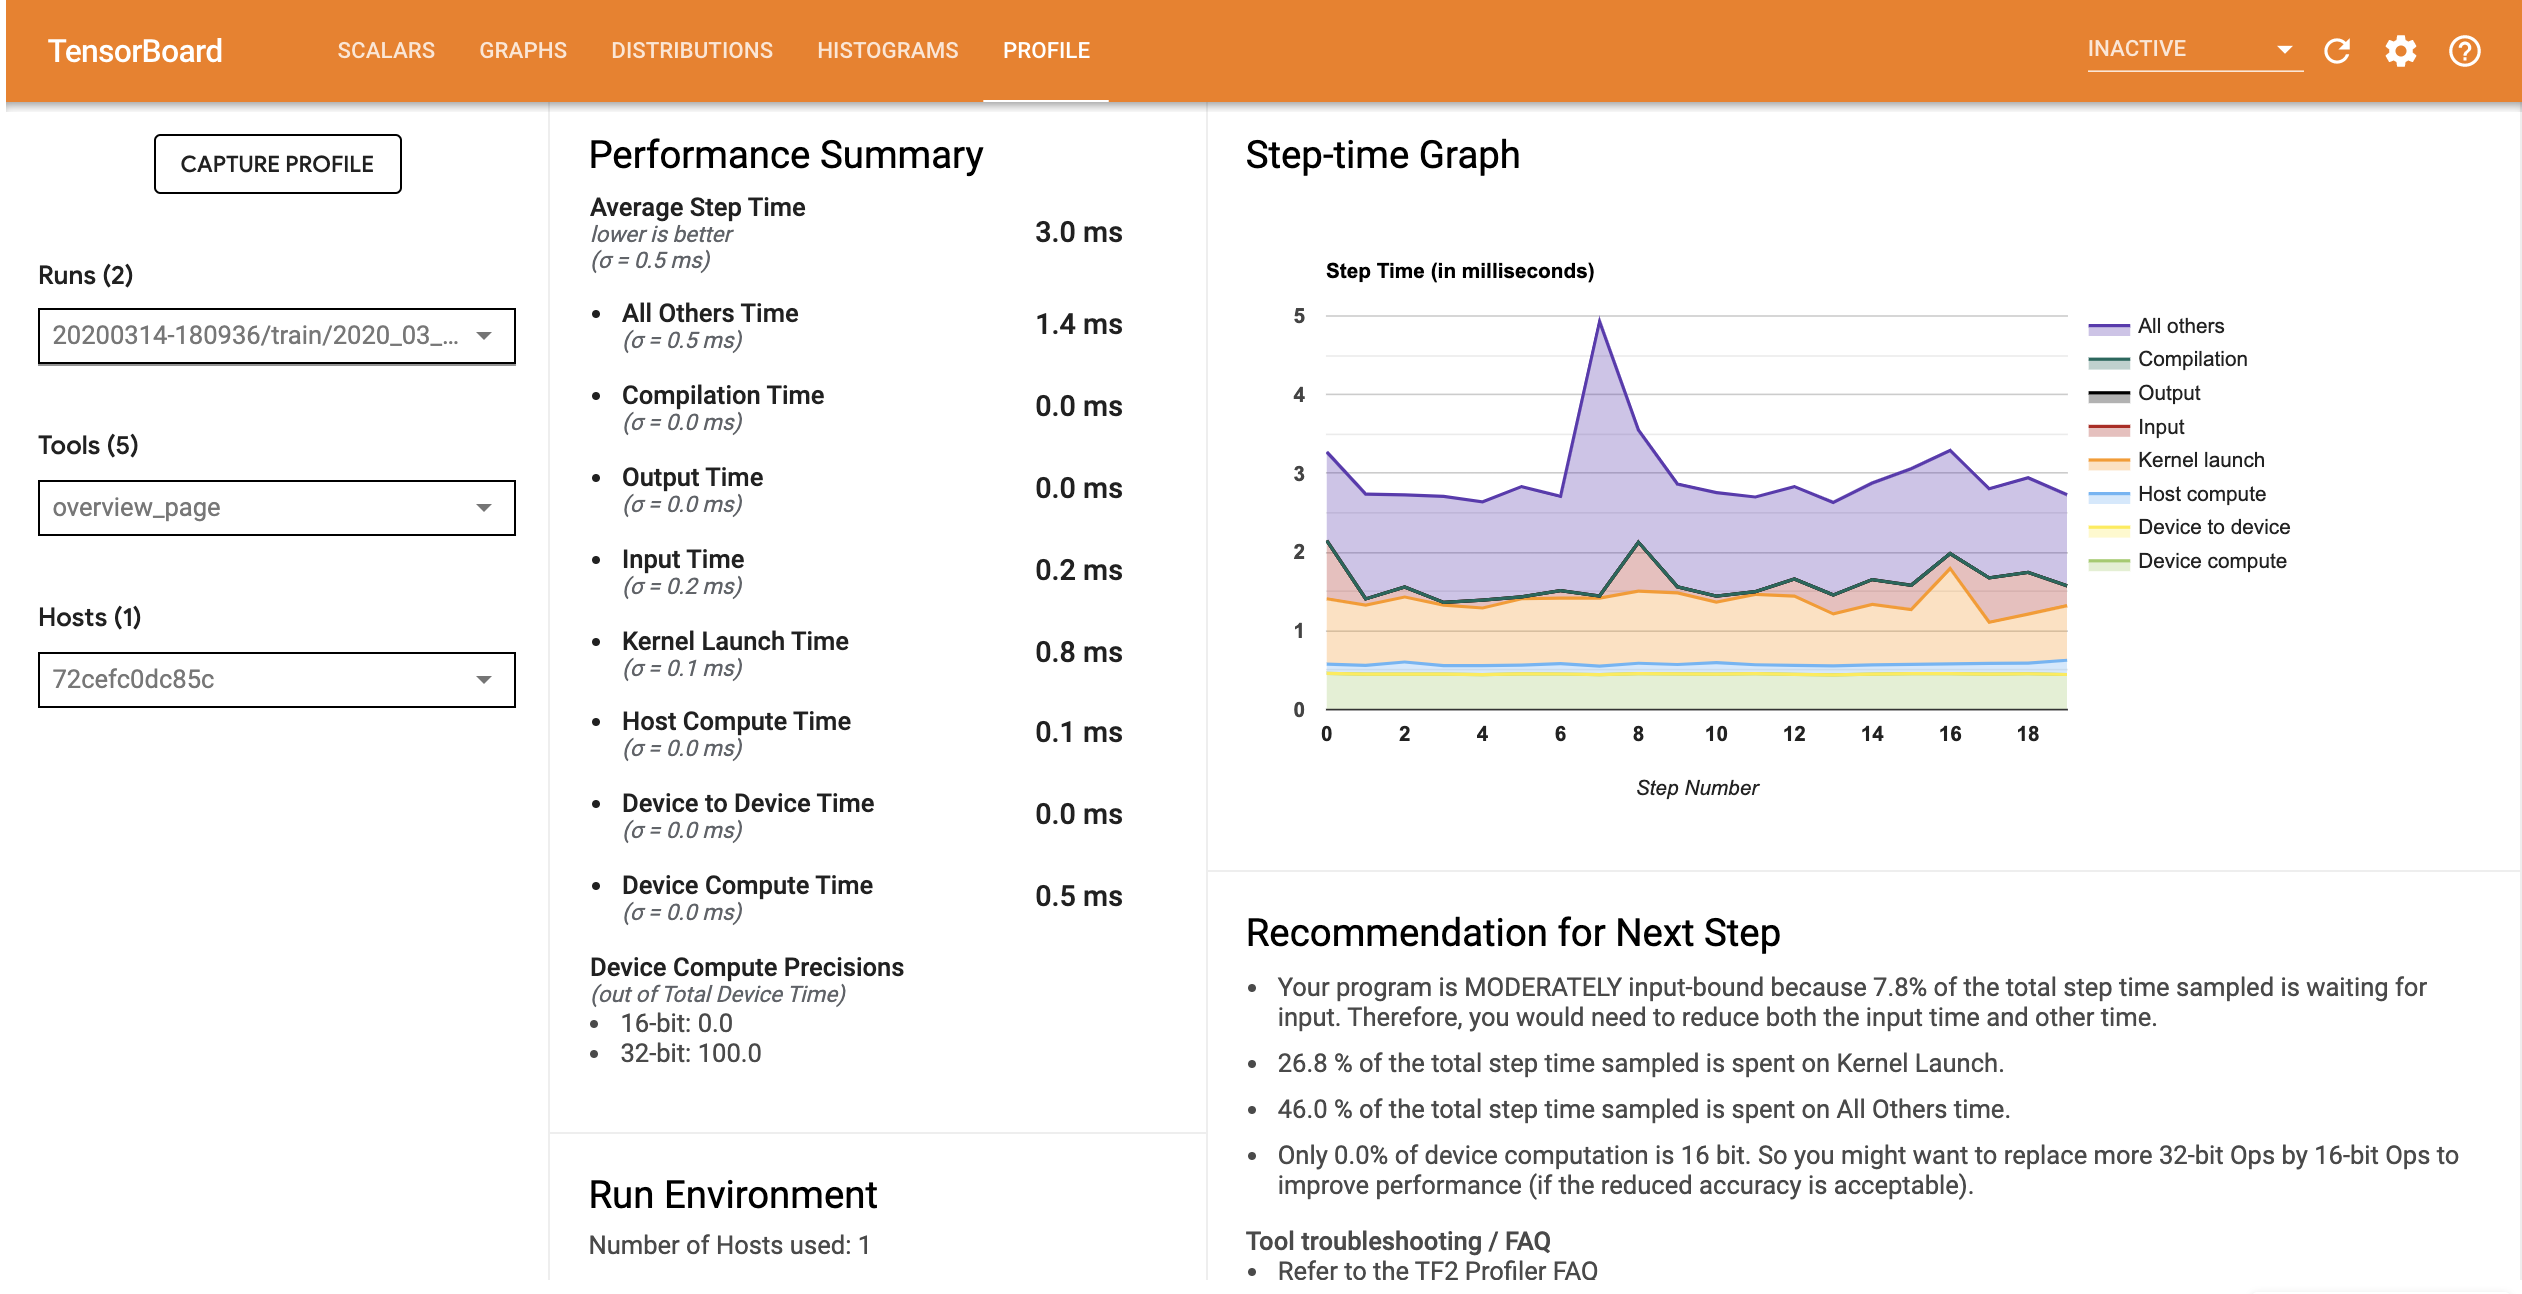
从 Overview 页面中,您可以看到 Average Step Time 和 Input Step Time 都在减少。Step-time Graph 还表明模型不再高度受输入约束。打开 Trace Viewer 可以使用优化的输入流水线检查跟踪事件。
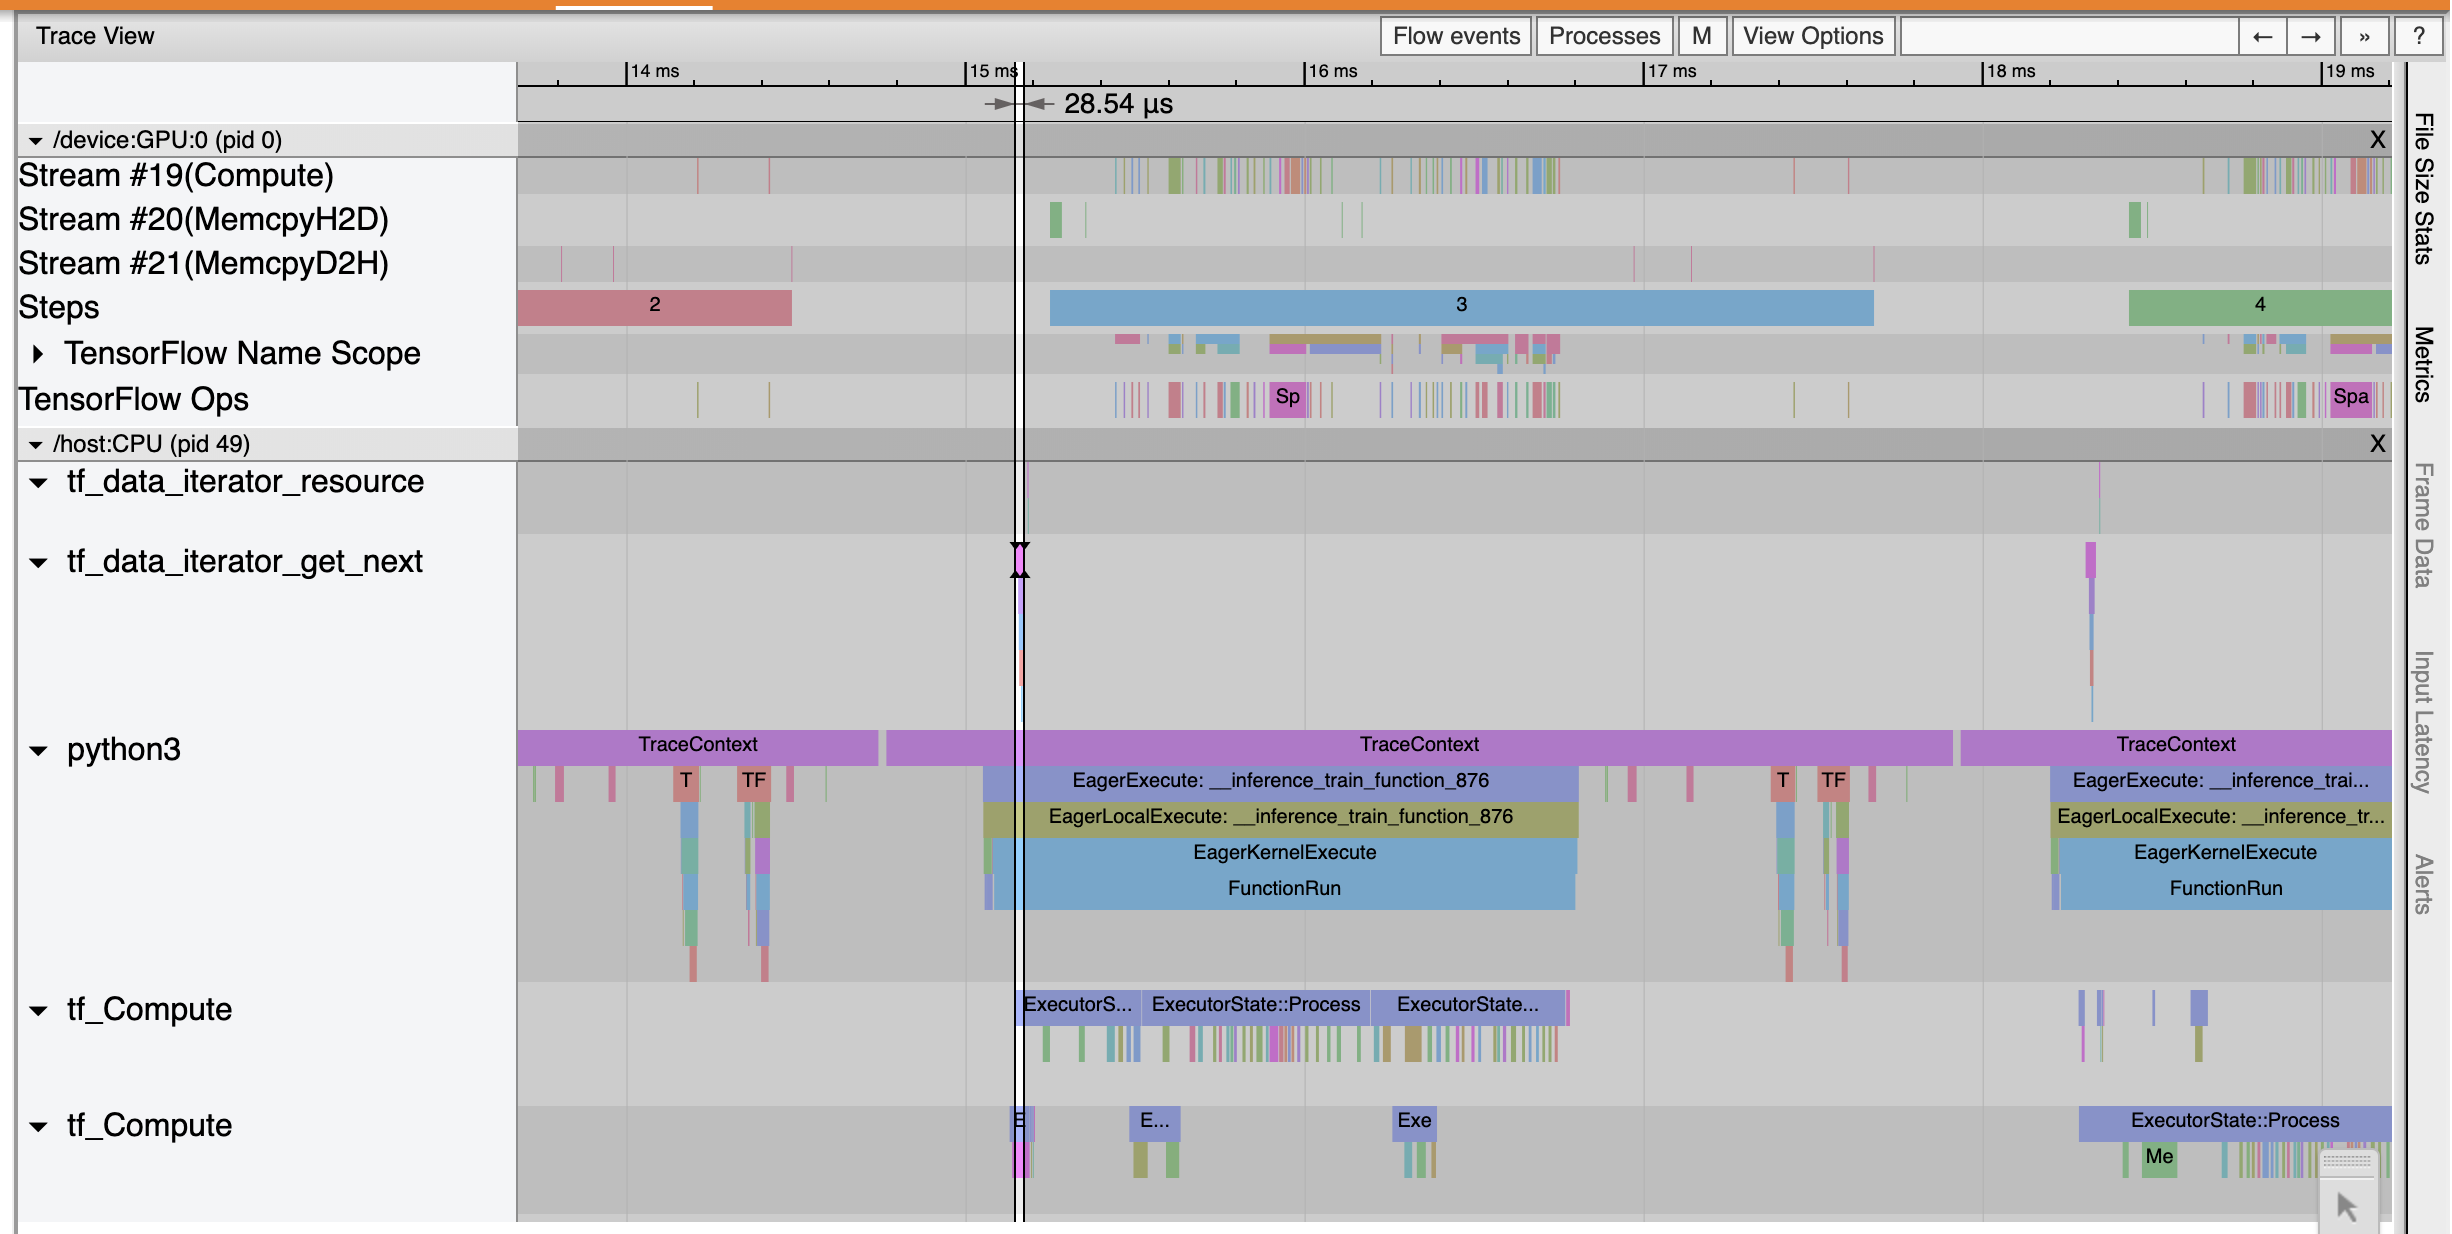
Trace Viewer 显示出 tf_data_iterator_get_next 运算执行得更快。因此,GPU 获得了稳定的数据流来执行训练,并通过模型训练获得了更高的利用率。
总结
使用 TensorFlow Profiler 可以剖析和调试模型训练性能。阅读 Profiler 指南并观看 2020 年 TensorFlow Dev Summit 2020 上的 TF 2 中的性能剖析演讲,详细了解 TensorFlow Profiler。