Overview
This guide assumes familiarity with the TensorFlow
Profiler and
tf.data. It aims to provide step by
step instructions with examples to help users diagnose and fix input pipeline
performance issues.
To begin, collect a profile of your TensorFlow job. Instructions on how to do so are available for CPUs/GPUs and Cloud TPUs.
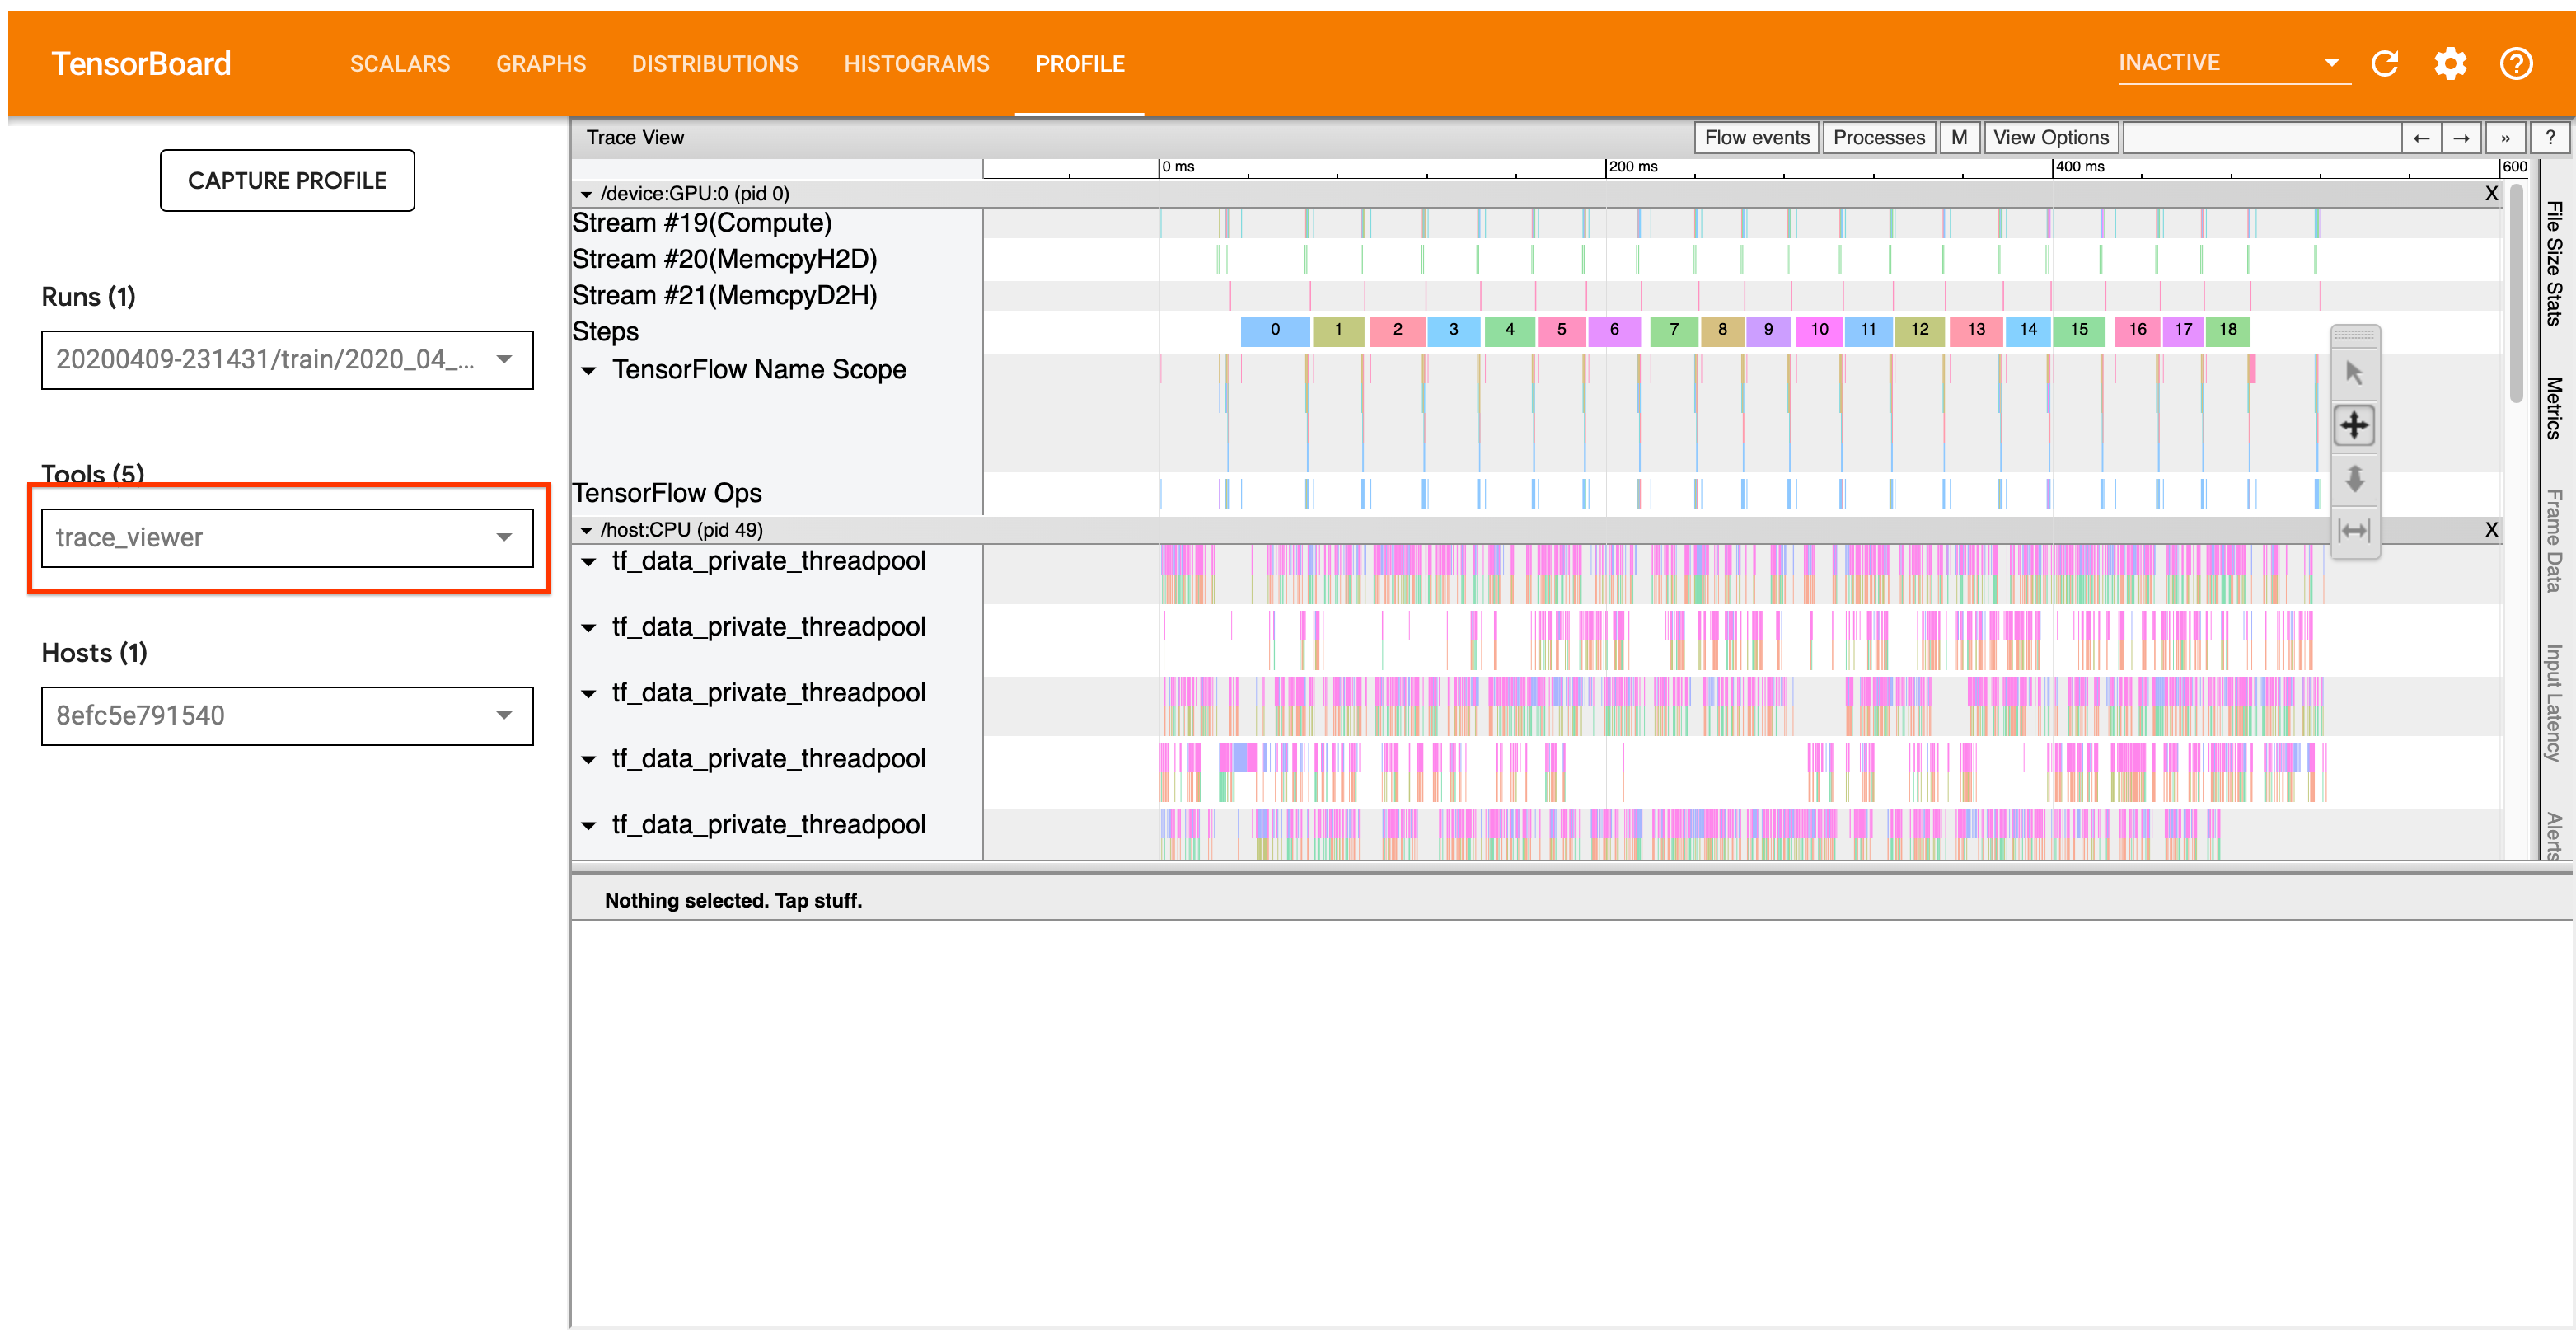
The analysis workflow detailed below focuses on the trace viewer tool in the
Profiler. This tool displays a timeline that shows the duration of ops executed
by your TensorFlow program and allows you to identify which ops take the longest
to execute. For more information on the trace viewer, check out
this section of the TF
Profiler guide. In general, tf.data events will appear on the host CPU
timeline.
Analysis Workflow
Please follow the workflow below. If you have feedback to help us improve it, please create a github issue with the label “comp:data”.
1. Is your tf.data pipeline producing data fast enough?
Begin by ascertaining whether the input pipeline is the bottleneck for your TensorFlow program.
To do so, look for IteratorGetNext::DoCompute ops in the trace viewer. In
general, you expect to see these at the start of a step. These slices represent
the time it takes for your input pipeline to yield a batch of elements when it
is requested. If you’re using keras or iterating over your dataset in a
tf.function, these should be found in tf_data_iterator_get_next threads.
Note that if you’re using a
distribution strategy,
you may see IteratorGetNextAsOptional::DoCompute events instead of
IteratorGetNext::DoCompute(as of TF 2.3).
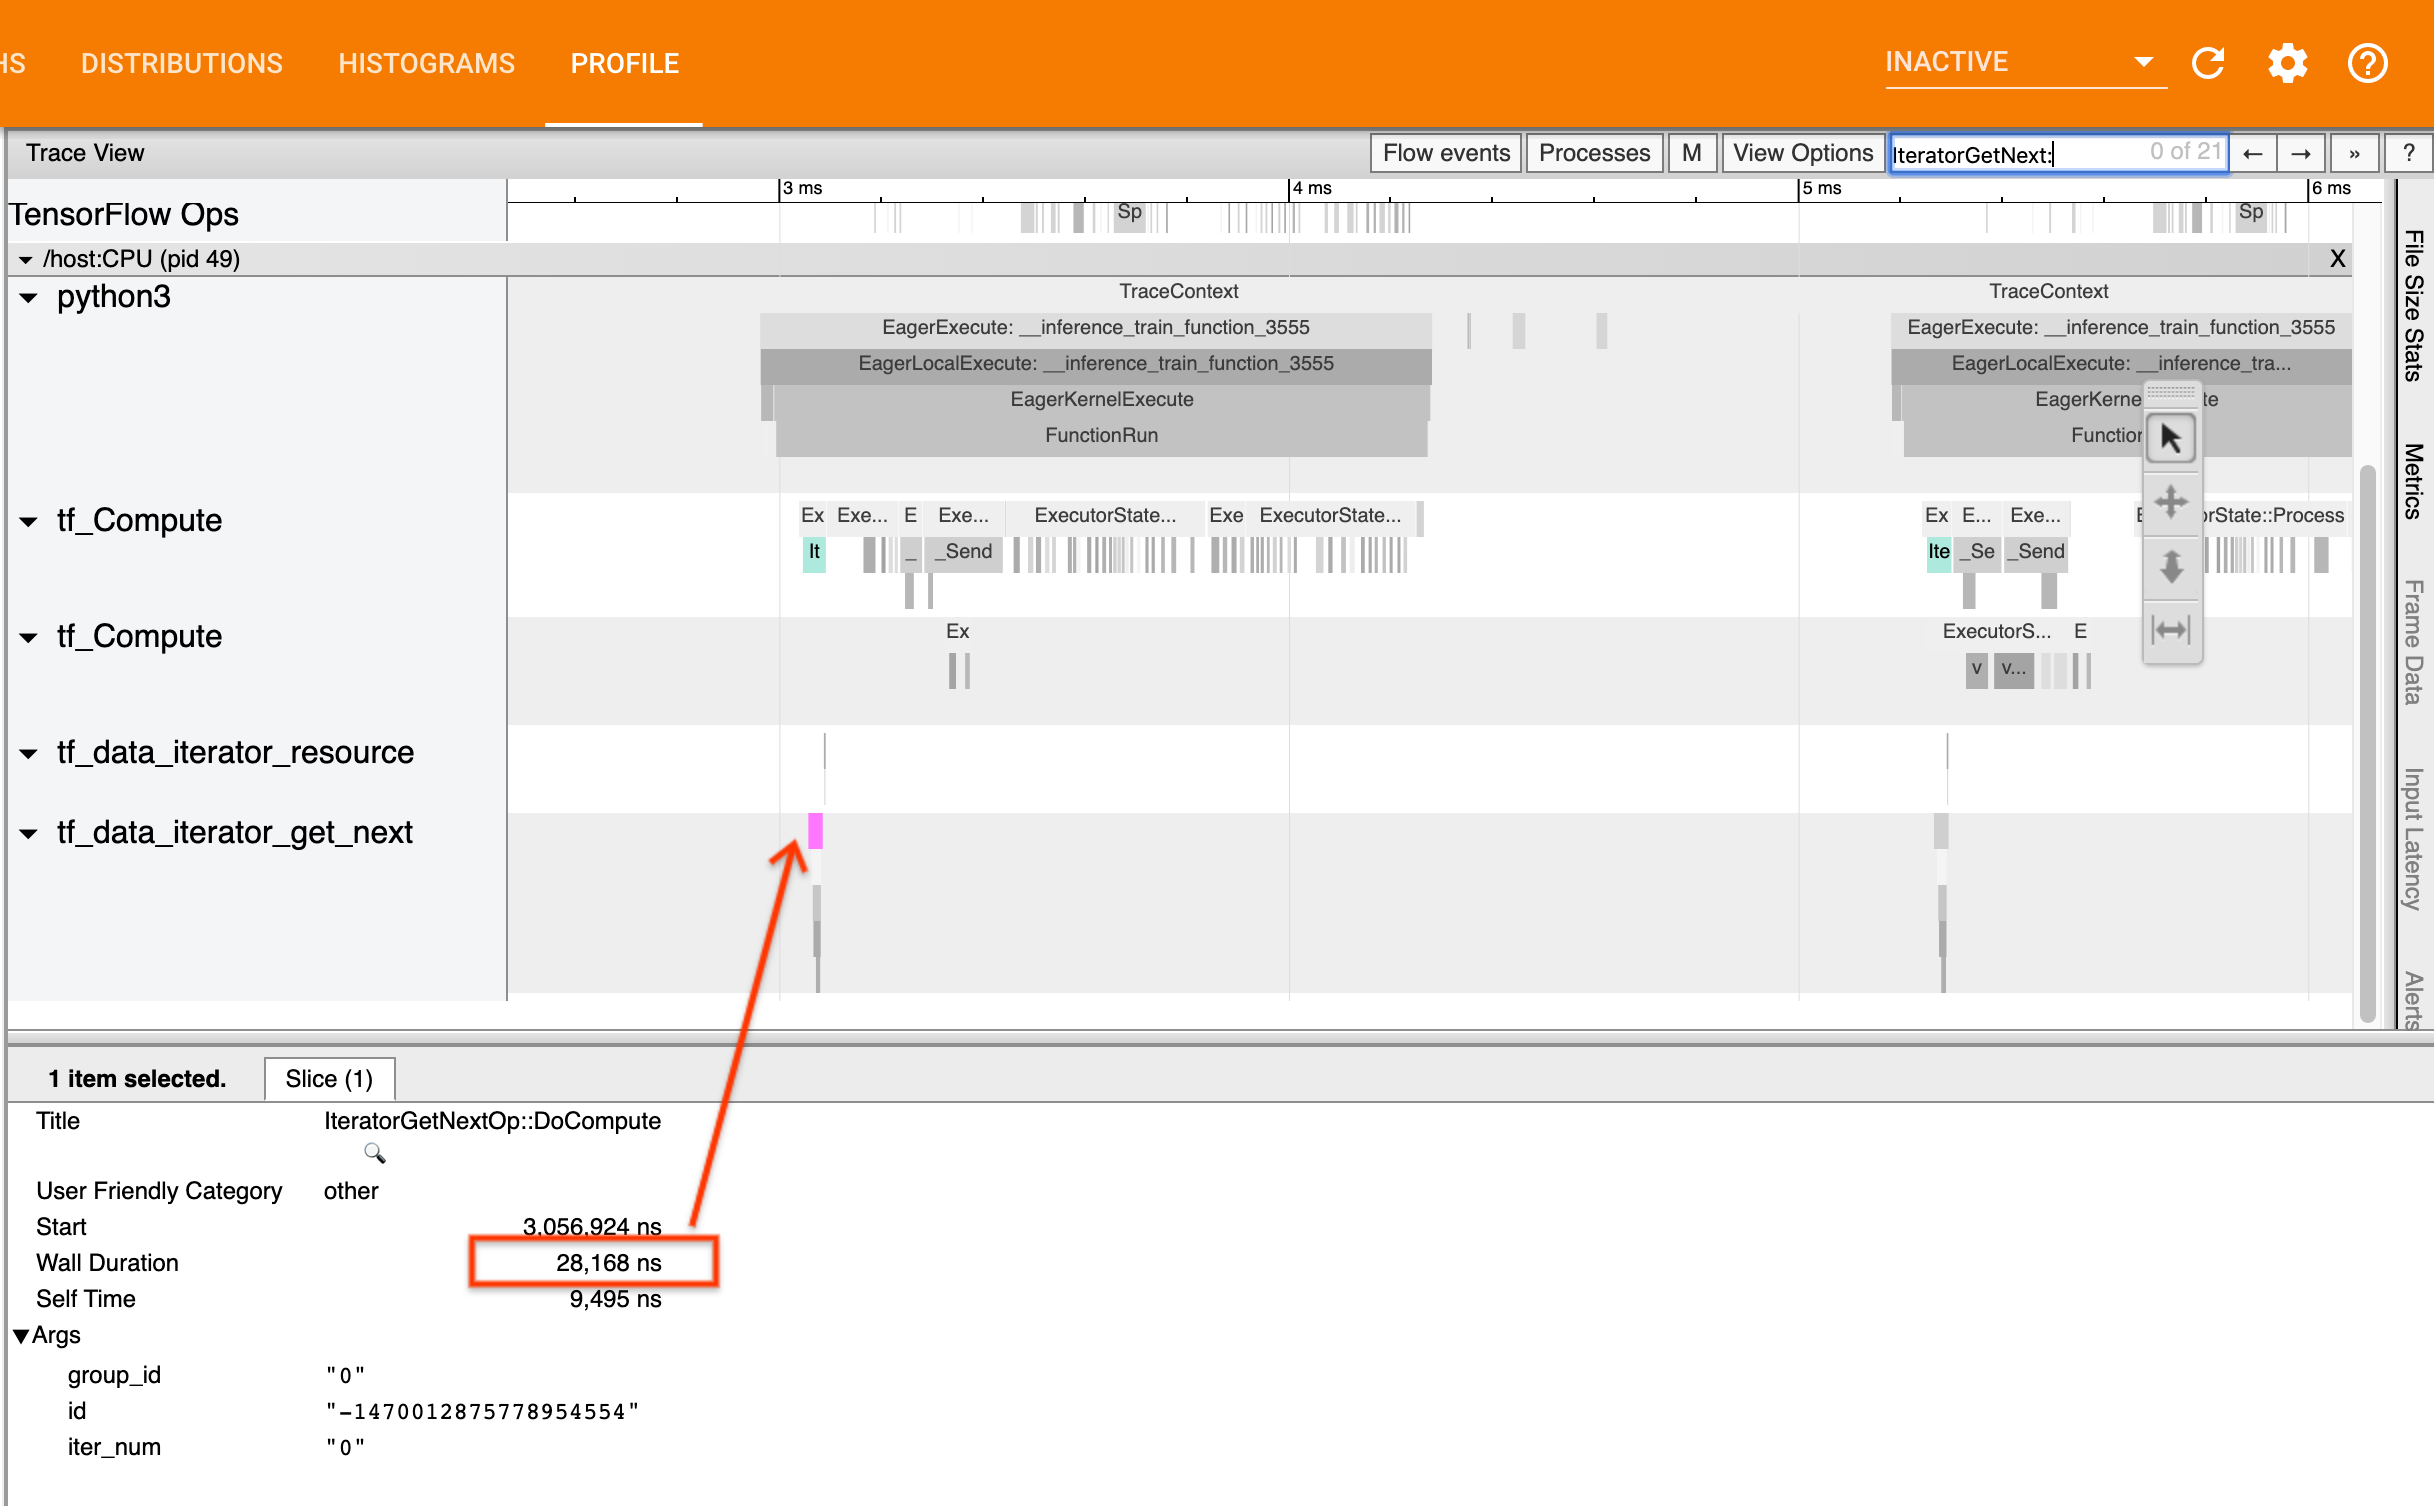
If the calls return quickly (<= 50 us), this means that your data is available when it is requested. The input pipeline is not your bottleneck; see the Profiler guide for more generic performance analysis tips.
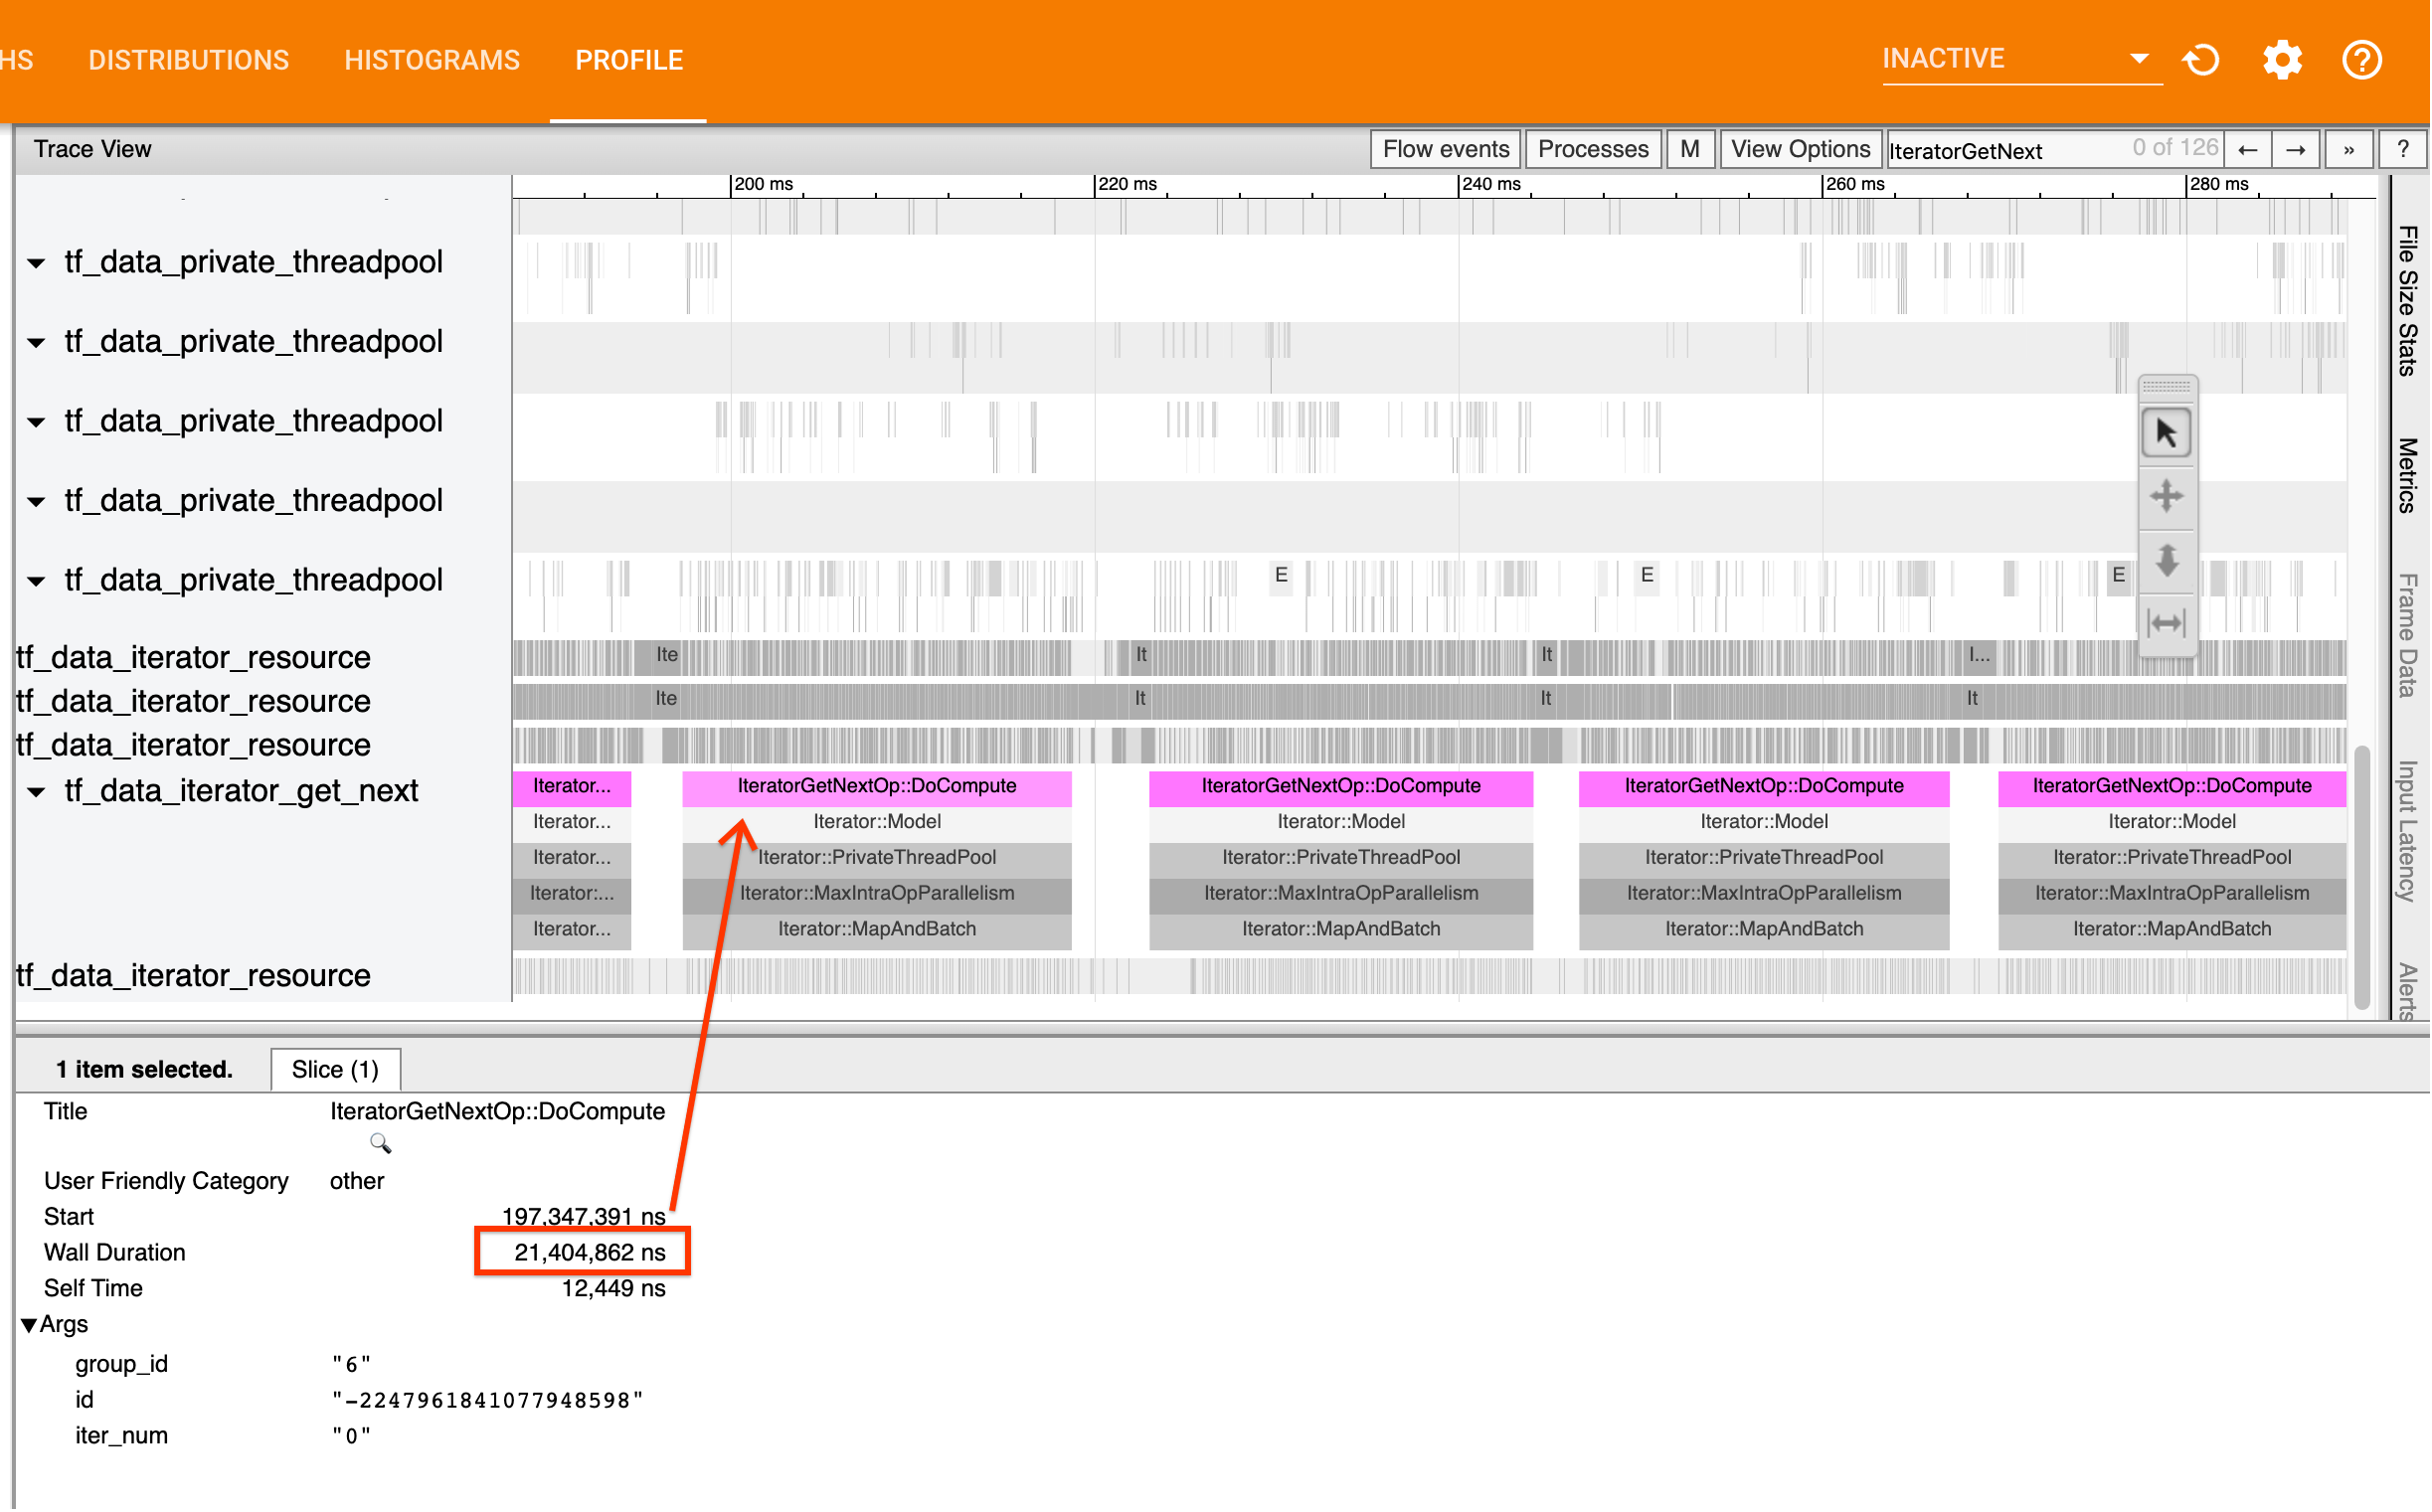
If the calls return slowly, tf.data is unable to keep up with the
consumer’s requests. Continue to the next section.
2. Are you prefetching data?
The best practice for input pipeline performance is to insert a
tf.data.Dataset.prefetch transformation at the end of your tf.data pipeline.
This transformation overlaps the input pipeline’s preprocessing computation with
the next step of model computation and is required for optimal input pipeline
performance when training your model. If you’re prefetching data, you should see
a Iterator::Prefetch slice on the same thread as the
IteratorGetNext::DoCompute op.
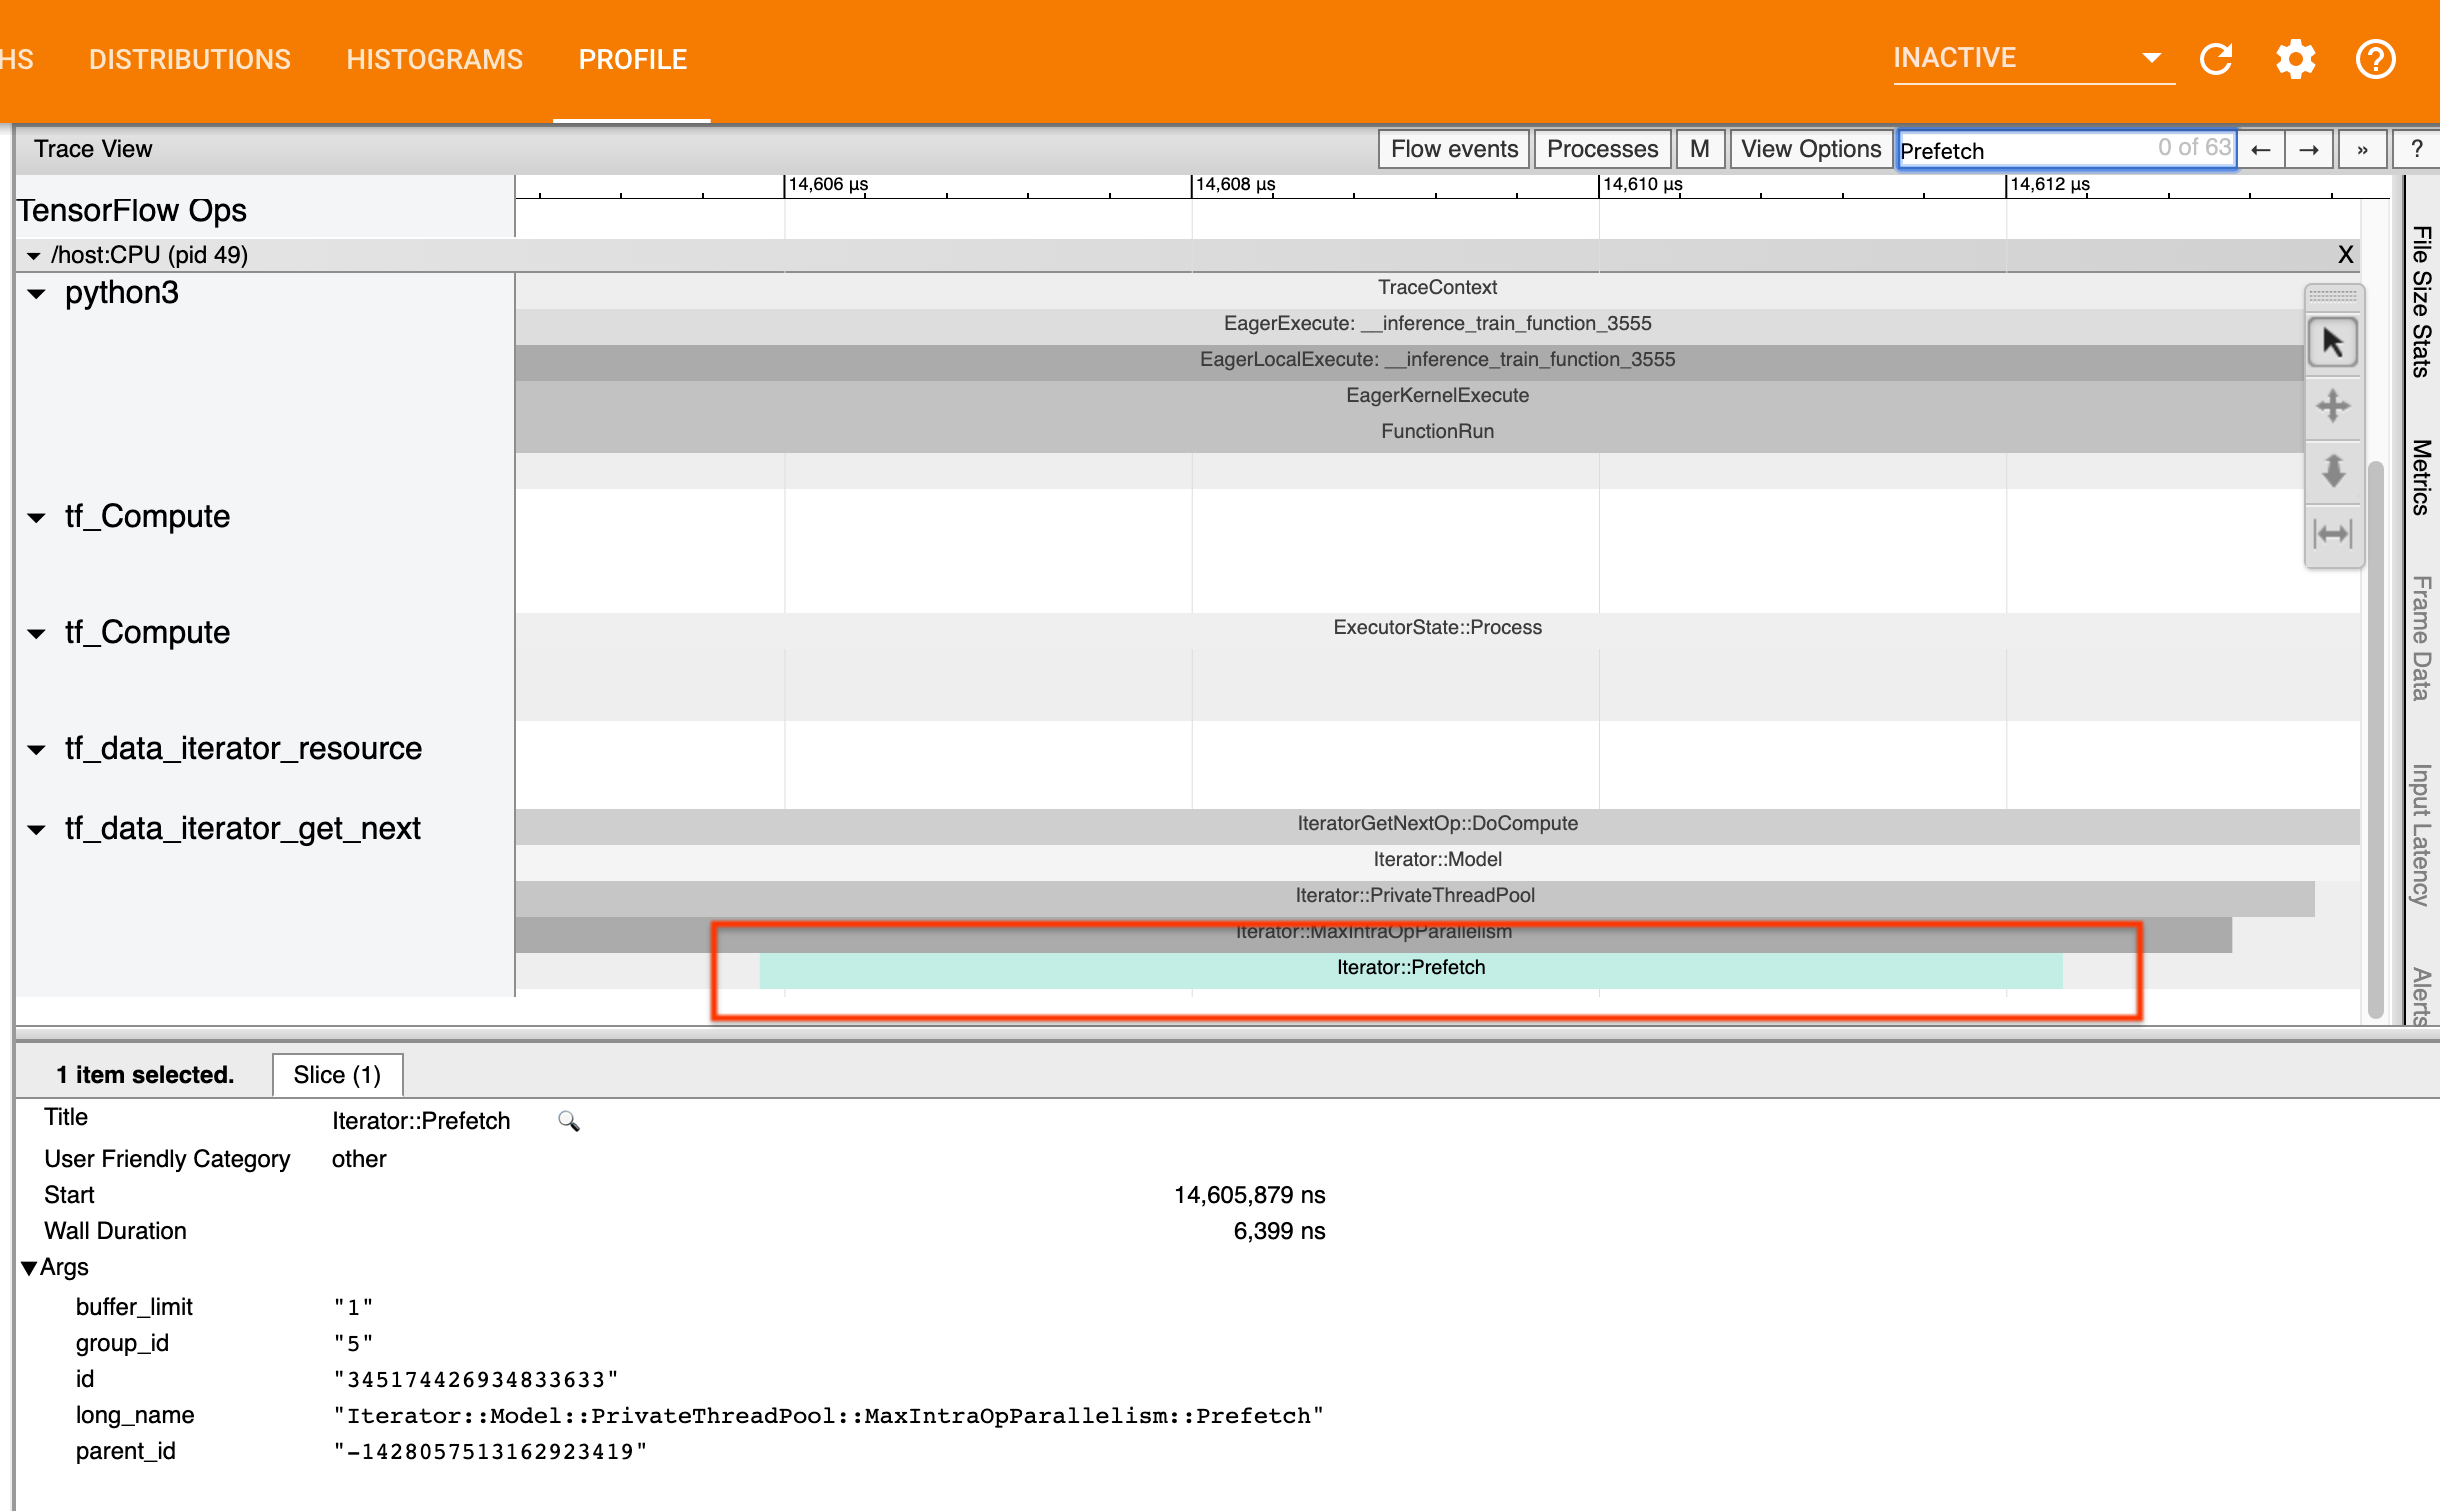
If you don’t have a prefetch at the end of your pipeline, you should add
one. For more information about tf.data performance recommendations, see the
tf.data performance guide.
If you’re already prefetching data, and the input pipeline is still your bottleneck, continue to the next section to further analyze performance.
3. Are you reaching high CPU utilization?
tf.data achieves high throughput by trying to make the best possible use of
available resources. In general, even when running your model on an accelerator
like a GPU or TPU, the tf.data pipelines are run on the CPU. You can check
your utilization with tools like sar and
htop, or in the
cloud monitoring console if you’re running on GCP.
If your utilization is low, this suggests that your input pipeline may not be taking full advantage of the host CPU. You should consult the tf.data performance guide for best practices. If you have applied the best practices and utilization and throughput remain low, continue to Bottleneck analysis below.
If your utilization is approaching the resource limit, in order to improve performance further, you need to either improve the efficiency of your input pipeline (for example, avoiding unnecessary computation) or offload computation.
You can improve the efficiency of your input pipeline by avoiding unnecessary
computation in tf.data. One way of doing this is inserting a
tf.data.Dataset.cache
transformation after computation-intensive work if your data fits into memory;
this reduces computation at the cost of increased memory usage. Additionally,
disabling intra-op parallelism in tf.data has the potential to increase
efficiency by > 10%, and can be done by setting the following option on your
input pipeline:
dataset = ...
options = tf.data.Options()
options.experimental_threading.max_intra_op_parallelism = 1
dataset = dataset.with_options(options)
4. Bottleneck Analysis
The following section walks through how to read tf.data events in the trace
viewer to understand where the bottleneck is and possible mitigation strategies.
Understanding tf.data events in the Profiler
Each tf.data event in the Profiler has the name Iterator::<Dataset>, where
<Dataset> is the name of the dataset source or transformation. Each event also
has the long name Iterator::<Dataset_1>::...::<Dataset_n>, which you can see
by clicking on the tf.data event. In the long name, <Dataset_n> matches
<Dataset> from the (short) name, and the other datasets in the long name
represent downstream transformations.
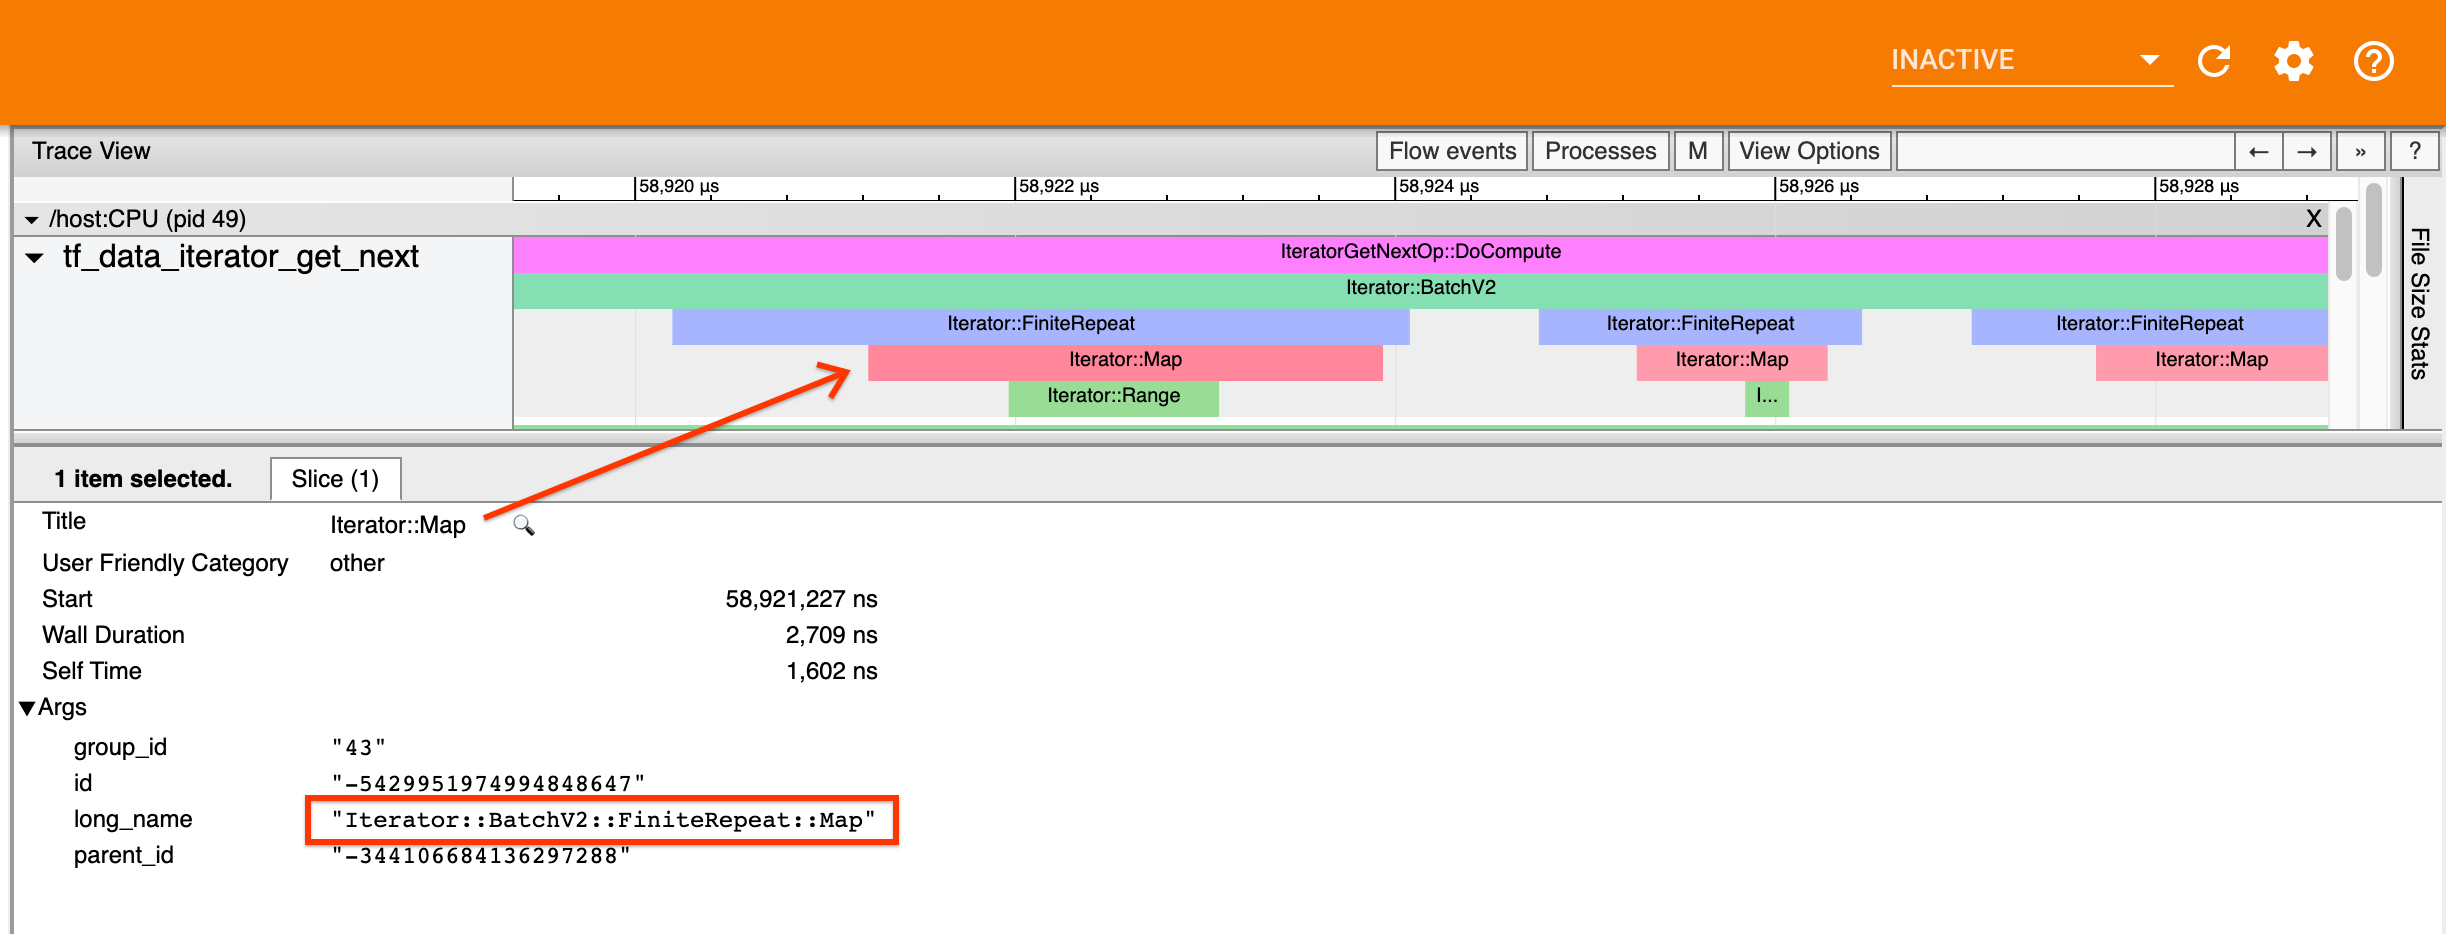
For example, the above screenshot was generated from the following code:
dataset = tf.data.Dataset.range(10)
dataset = dataset.map(lambda x: x)
dataset = dataset.repeat(2)
dataset = dataset.batch(5)
Here, the Iterator::Map event has the long name
Iterator::BatchV2::FiniteRepeat::Map. Note that the datasets name may differ
slightly from the python API (for example, FiniteRepeat instead of Repeat), but
should be intuitive enough to parse.
Synchronous and asynchronous transformations
For synchronous tf.data transformations (such as Batch and Map), you will
see events from upstream transformations on the same thread. In the above
example, since all the transformations used are synchronous, all the events
appear on the same thread.
For asynchronous transformations (such as Prefetch, ParallelMap,
ParallelInterleave and MapAndBatch) events from upstream transformations
will be on a different thread. In such cases, the “long name” can help you
identify which transformation in a pipeline an event corresponds to.
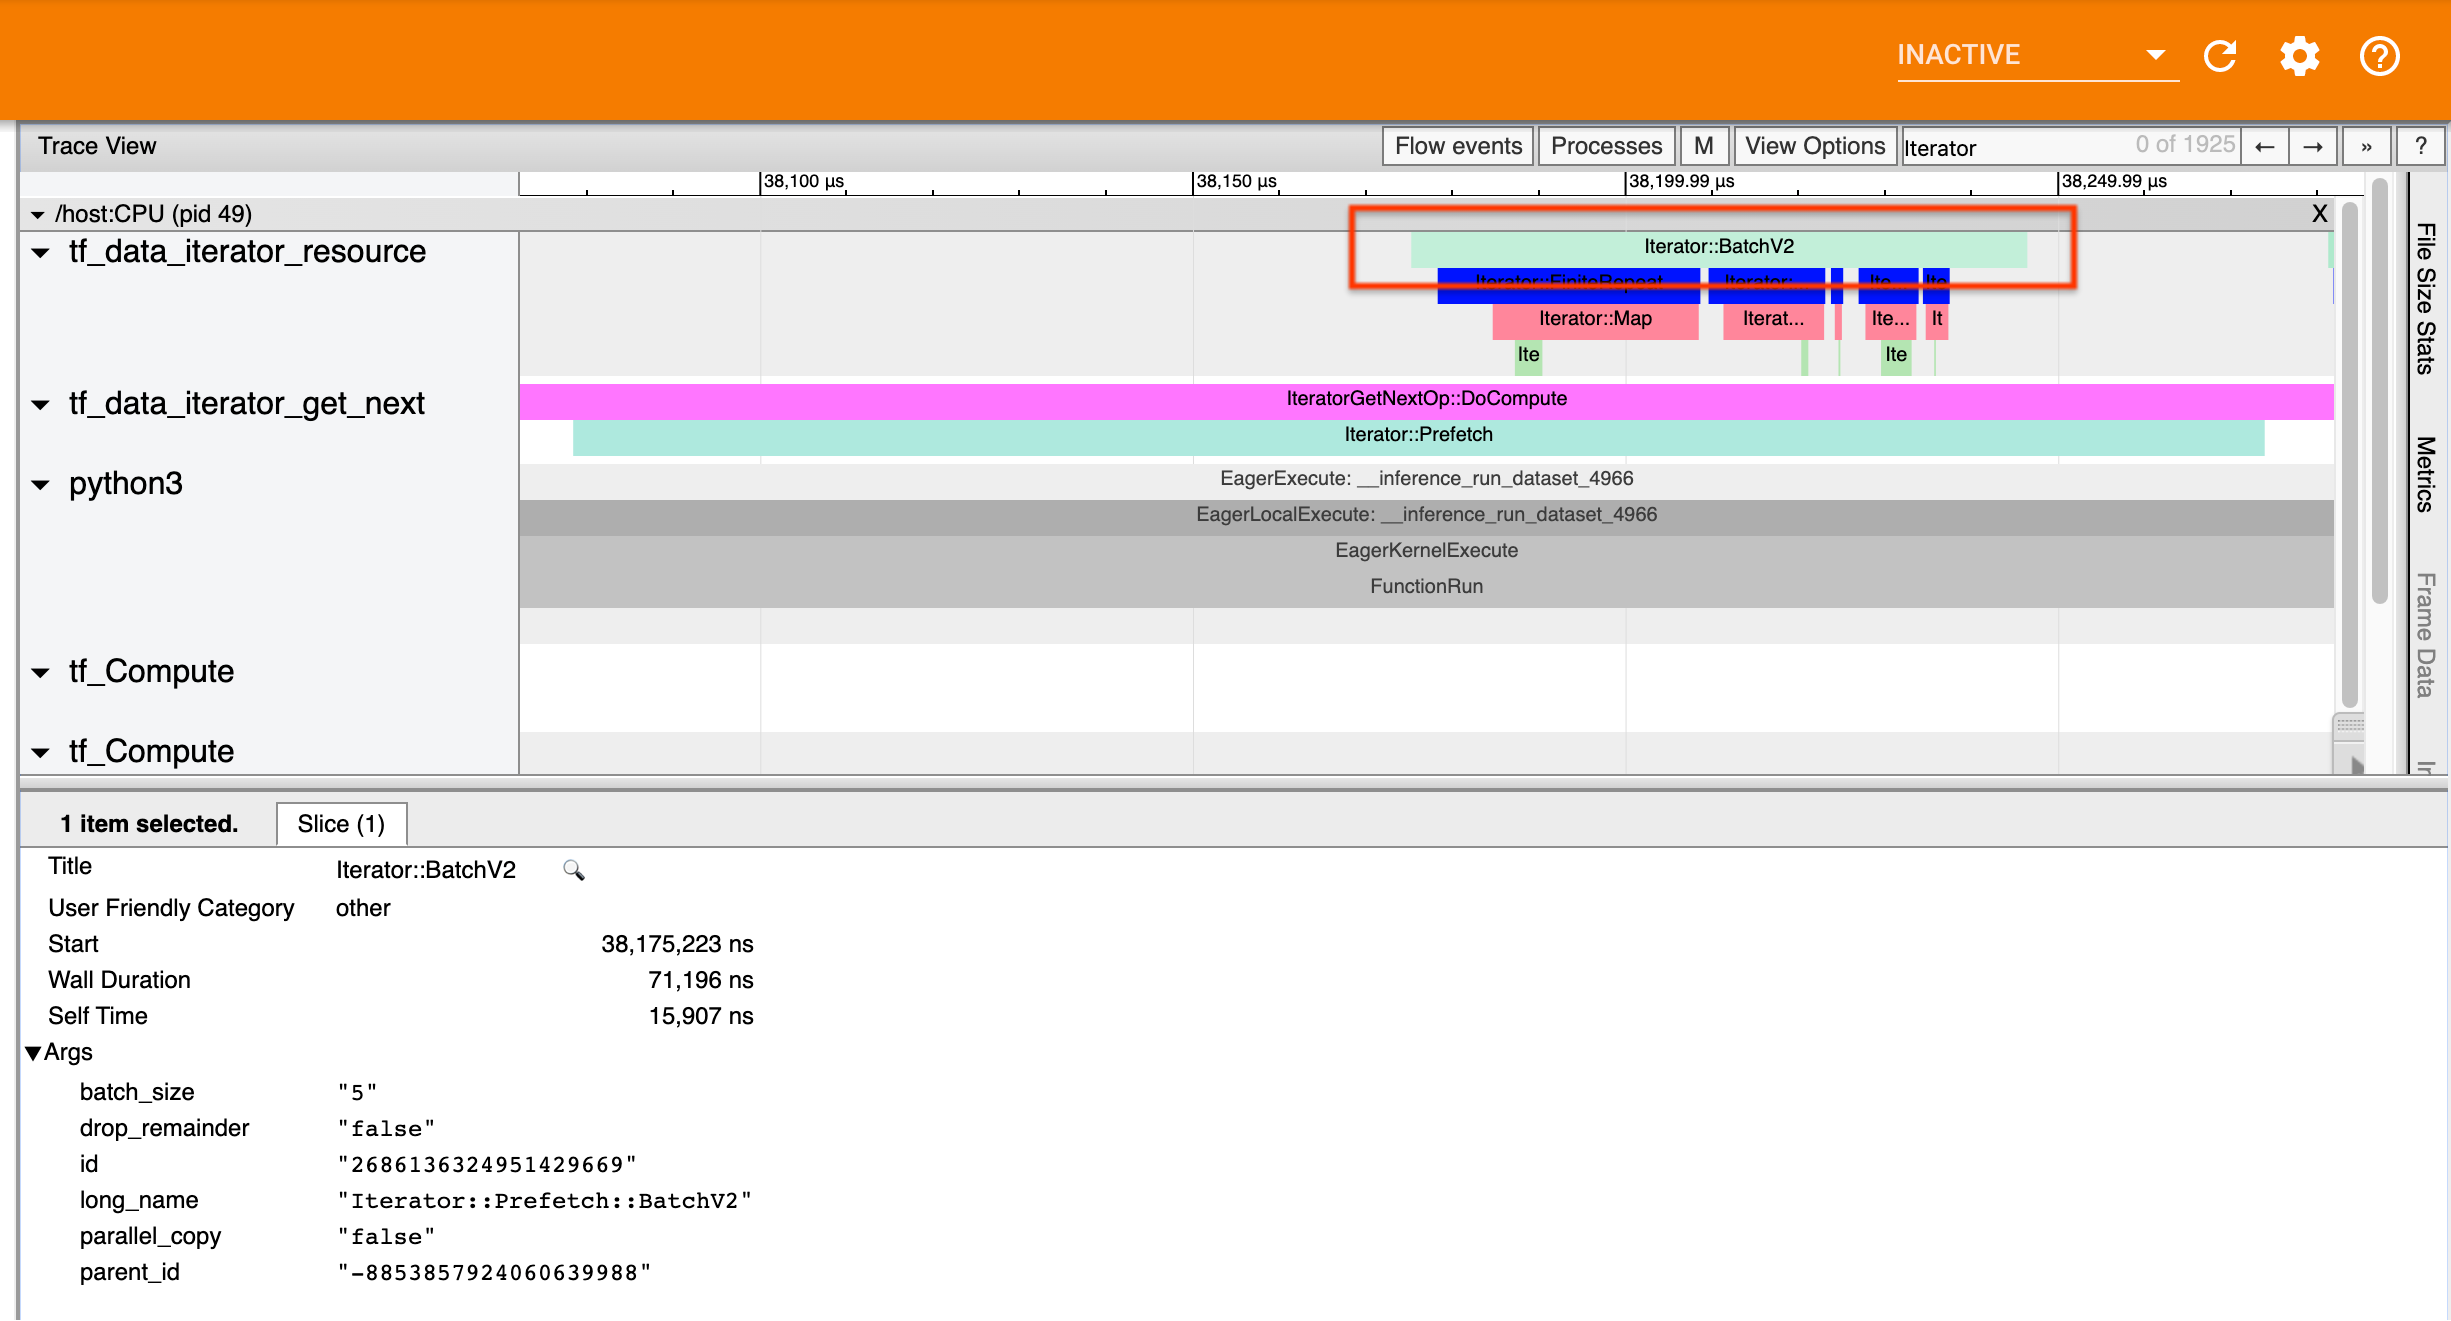
For example, the above screenshot was generated from the following code:
dataset = tf.data.Dataset.range(10)
dataset = dataset.map(lambda x: x)
dataset = dataset.repeat(2)
dataset = dataset.batch(5)
dataset = dataset.prefetch(1)
Here, the Iterator::Prefetch events are on the tf_data_iterator_get_next
threads. Since Prefetch is asynchronous, its input events (BatchV2) will be
on a different thread, and can be located by searching for the long name
Iterator::Prefetch::BatchV2. In this case, they are on the
tf_data_iterator_resource thread. From its long name, you can deduce that
BatchV2 is upstream of Prefetch. Furthermore, the parent_id of the
BatchV2 event will match the ID of the Prefetch event.
Identifying the bottleneck
In general, to identify the bottleneck in your input pipeline, walk the input
pipeline from the outermost transformation all the way to the source. Starting
from the final transformation in your pipeline, recurse into upstream
transformations until you find a slow transformation or reach a source dataset,
such as TFRecord. In the example above, you would start from Prefetch, then
walk upstream to BatchV2, FiniteRepeat, Map, and finally Range.
In general, a slow transformation corresponds to one whose events are long, but whose input events are short. Some examples follow below.
Note that the final (outermost) transformation in most host input pipelines is
the Iterator::Model event. The Model transformation is introduced
automatically by the tf.data runtime and is used for instrumenting and
autotuning the input pipeline performance.
If your job is using a
distribution strategy,
the trace viewer will contain additional events that correspond to the device
input pipeline. The outermost transformation of the device pipeline (nested
under IteratorGetNextOp::DoCompute or
IteratorGetNextAsOptionalOp::DoCompute) will be an Iterator::Prefetch event
with an upstream Iterator::Generator event. You can find the corresponding
host pipeline by searching for Iterator::Model events.
Example 1
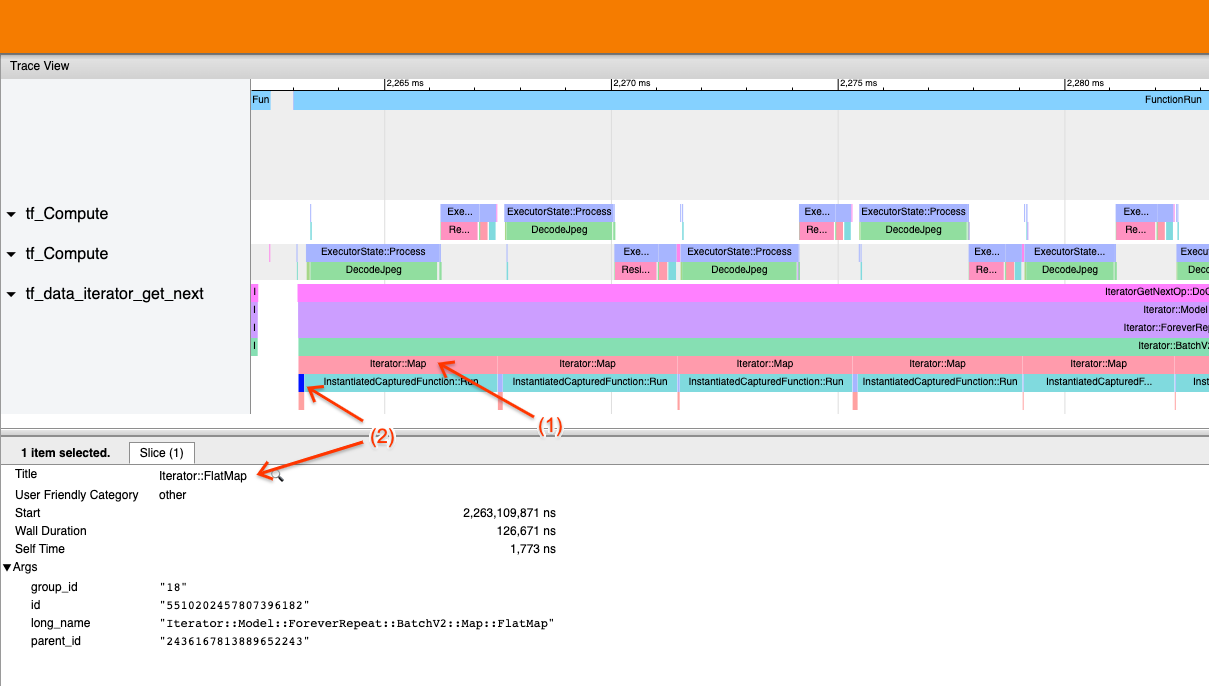
The above screenshot is generated from the following input pipeline:
dataset = tf.data.TFRecordDataset(filename)
dataset = dataset.map(parse_record)
dataset = dataset.batch(32)
dataset = dataset.repeat()
In the screenshot, observe that (1) Iterator::Map events are long, but (2) its
input events (Iterator::FlatMap) return quickly. This suggests that the
sequential Map transformation is the bottleneck.
Note that in the screenshot, the InstantiatedCapturedFunction::Run event
corresponds to the time it takes to execute the map function.
Example 2
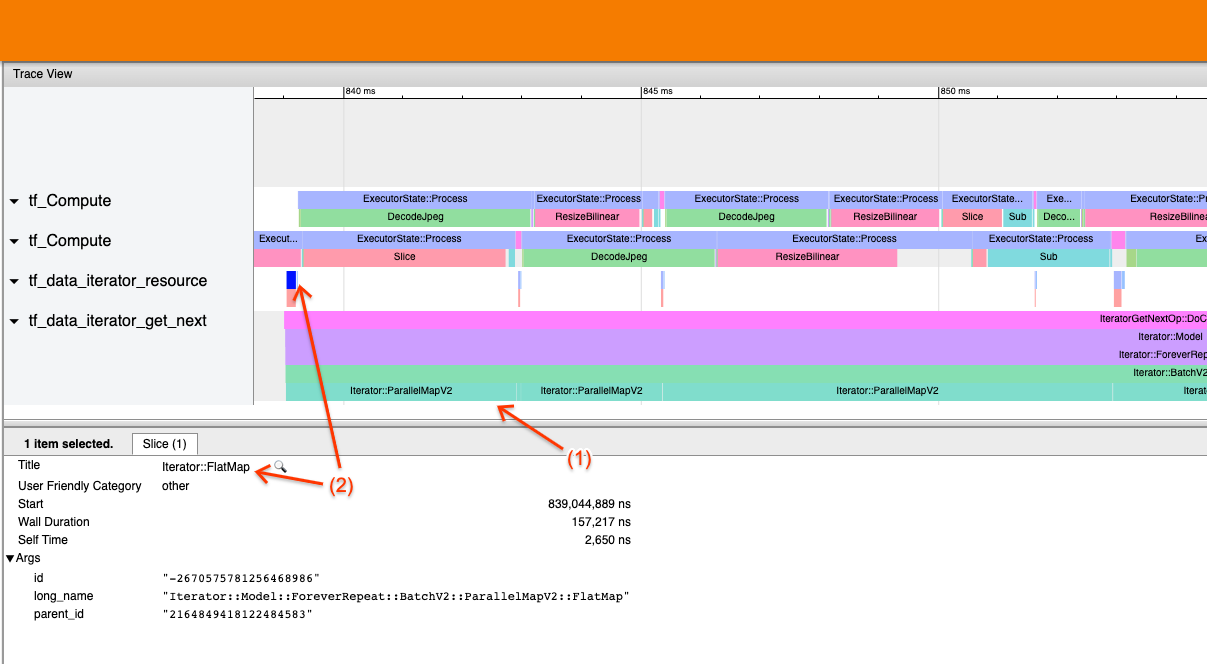
The above screenshot is generated from the following input pipeline:
dataset = tf.data.TFRecordDataset(filename)
dataset = dataset.map(parse_record, num_parallel_calls=2)
dataset = dataset.batch(32)
dataset = dataset.repeat()
This example is similar to the above, but uses ParallelMap instead of Map. We
notice here that (1) Iterator::ParallelMap events are long, but (2) its input
events Iterator::FlatMap (which are on a different thread, since ParallelMap
is asynchronous) are short. This suggests that the ParallelMap transformation is
the bottleneck.
Addressing the bottleneck
Source datasets
If you’ve identified a dataset source as the bottleneck, such as reading from
TFRecord files, you can improve performance by parallelizing data extraction. To
do so, ensure that your data is sharded across multiple files and use
tf.data.Dataset.interleave with the num_parallel_calls parameter set to
tf.data.AUTOTUNE. If determinism is not important to your
program, you can further improve performance by setting the
deterministic=False flag on tf.data.Dataset.interleave as of TF 2.2. For
example, if you’re reading from TFRecords, you can do the following:
dataset = tf.data.Dataset.from_tensor_slices(filenames)
dataset = dataset.interleave(tf.data.TFRecordDataset,
  num_parallel_calls=tf.data.AUTOTUNE,
  deterministic=False)
Note that sharded files should be reasonably large to amortize the overhead of
opening a file. For more details on parallel data extraction, see
this section
of the tf.data performance guide.
Transformation datasets
If you’ve identified an intermediate tf.data transformation as the bottleneck,
you can address it by parallelizing the transformation or
caching the computation
if your data fits into memory and it is appropriate. Some transformations such
as Map have parallel counterparts; the
tf.data performance guide demonstrates
how to parallelize these. Other transformations, such as Filter, Unbatch,
and Batch are inherently sequential; you can parallelize them by introducing
“outer parallelism”. For example, supposing your input pipeline initially looks
like the following, with Batch as the bottleneck:
filenames = tf.data.Dataset.list_files(file_path, shuffle=is_training)
dataset = filenames_to_dataset(filenames)
dataset = dataset.batch(batch_size)
You can introduce “outer parallelism” by running multiple copies of the input pipeline over sharded inputs and combining the results:
filenames = tf.data.Dataset.list_files(file_path, shuffle=is_training)

def make_dataset(shard_index):
  filenames = filenames.shard(NUM_SHARDS, shard_index)
  dataset = filenames_to_dataset(filenames)
  Return dataset.batch(batch_size)

indices = tf.data.Dataset.range(NUM_SHARDS)
dataset = indices.interleave(make_dataset,
                             num_parallel_calls=tf.data.AUTOTUNE)
dataset = dataset.prefetch(tf.data.AUTOTUNE)
Additional resources
- tf.data performance guide
on how to write performance
tf.datainput pipelines - Inside TensorFlow video:
tf.databest practices - Profiler guide
- Profiler tutorial with colab
