การแสดงภาพการวิเคราะห์โมเดล TensorFlow
จัดทุกอย่างให้เป็นระเบียบอยู่เสมอด้วยคอลเล็กชัน
บันทึกและจัดหมวดหมู่เนื้อหาตามค่ากำหนดของคุณ
ผลลัพธ์ของการรันการประเมินคือ tfma.EvalResult
ซึ่งสามารถมองเห็นได้ในสมุดบันทึก Jupyter โดยการเรียก tfma.view.render_slicing_metrics
(หรือ tfma.view.render_plot
สำหรับแปลง)
มุมมองเมตริก
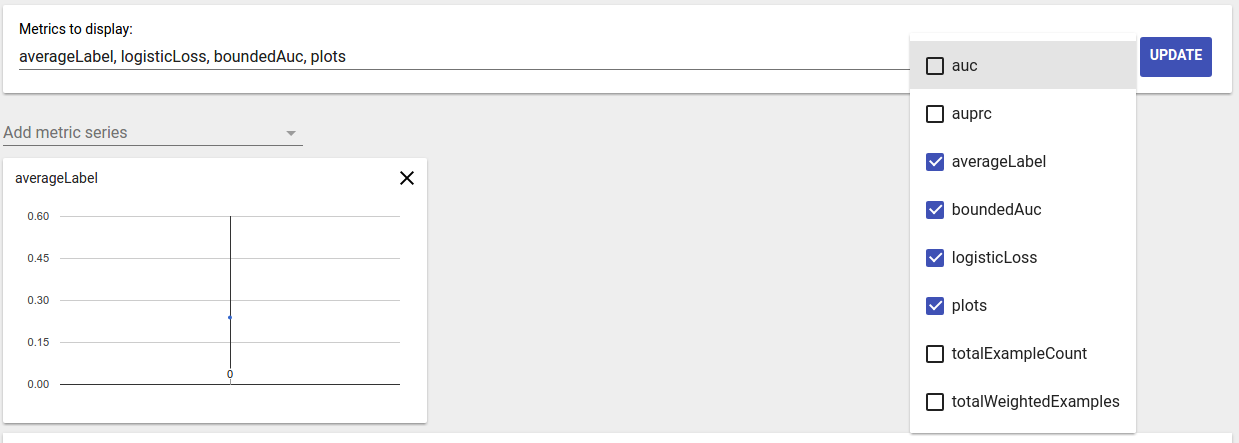
หากต้องการดูตัววัด ให้ใช้ tfma.view.render_slicing_metrics
API ผ่าน tfma.EvalResult
ที่ส่งออกจากการเรียกใช้การประเมิน มุมมองเมตริกประกอบด้วยสามส่วน:
ตัวเลือกเมตริก
ตามค่าเริ่มต้น หน่วยวัดที่คำนวณแล้วทั้งหมดจะแสดงขึ้น และคอลัมน์จะจัดเรียงตามตัวอักษร ตัวเลือกเมตริกช่วยให้ผู้ใช้สามารถเพิ่ม / ลบ / เรียงลำดับเมตริกใหม่ได้ เพียงทำเครื่องหมาย / ยกเลิกการทำเครื่องหมายหน่วยเมตริกจากเมนูแบบเลื่อนลง (กด Ctrl ค้างไว้เพื่อเลือกหลายรายการ) หรือพิมพ์ / จัดเรียงใหม่โดยตรงในช่องป้อนข้อมูล

การแสดงภาพเมตริก
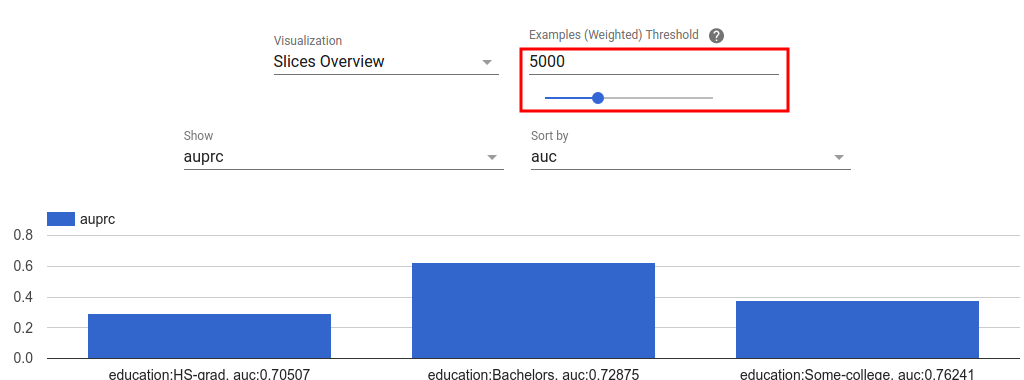
การแสดงภาพเมตริกมีจุดมุ่งหมายเพื่อให้สัญชาตญาณเกี่ยวกับส่วนต่างๆ ในคุณลักษณะที่เลือก มีการกรองอย่างรวดเร็วเพื่อกรองชิ้นที่มีจำนวนตัวอย่างที่มีน้ำหนักน้อยออก

รองรับการแสดงภาพสองประเภท:
ภาพรวมของชิ้นส่วน
ในมุมมองนี้ ค่าสำหรับเมทริกที่เลือกจะถูกเรนเดอร์สำหรับแต่ละสไลซ์ และสามารถจัดเรียงสไลซ์ตามชื่อสไลซ์หรือค่าของเมทริกอื่นได้

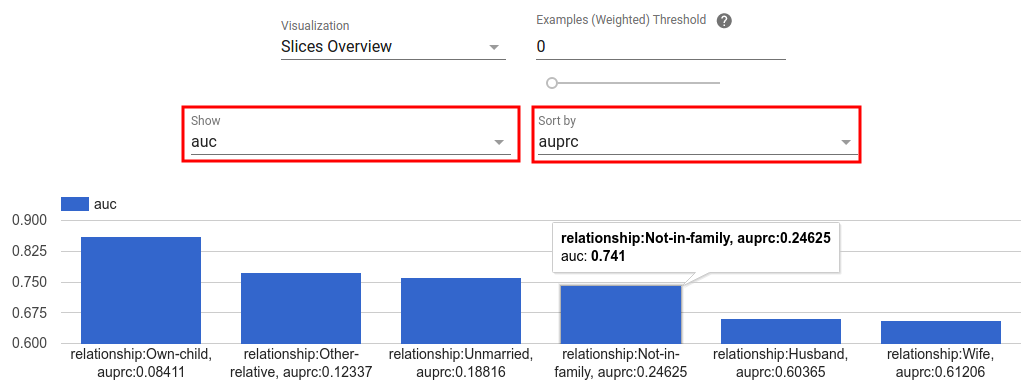
เมื่อจำนวนชิ้นมีขนาดเล็ก นี่คือมุมมองเริ่มต้น
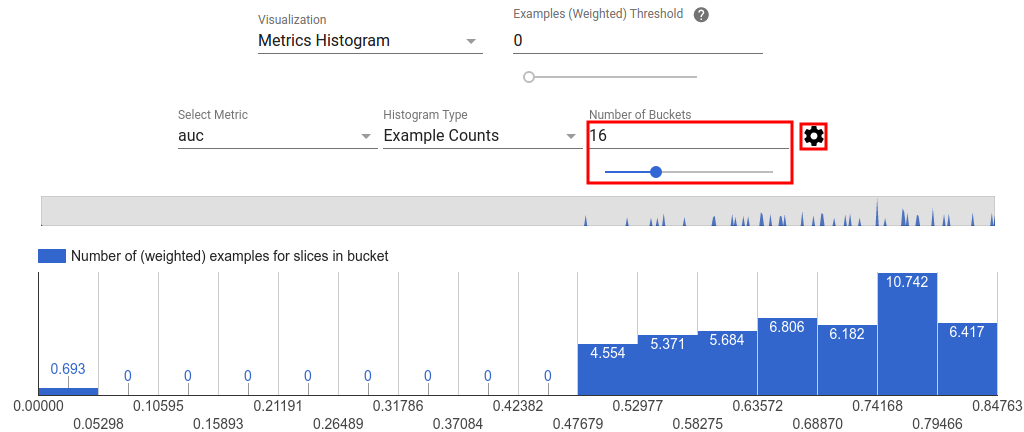
ฮิสโตแกรมเมตริก
ในมุมมองนี้ ชิ้นต่างๆ จะแบ่งออกเป็นกลุ่มต่างๆ ตามค่าเมตริก ค่าที่แสดงในแต่ละบัคเก็ตอาจเป็นจำนวนชิ้นในบัคเก็ตหรือจำนวนตัวอย่างที่ถ่วงน้ำหนักรวมสำหรับชิ้นทั้งหมดในบัคเก็ต หรือทั้งสองอย่าง

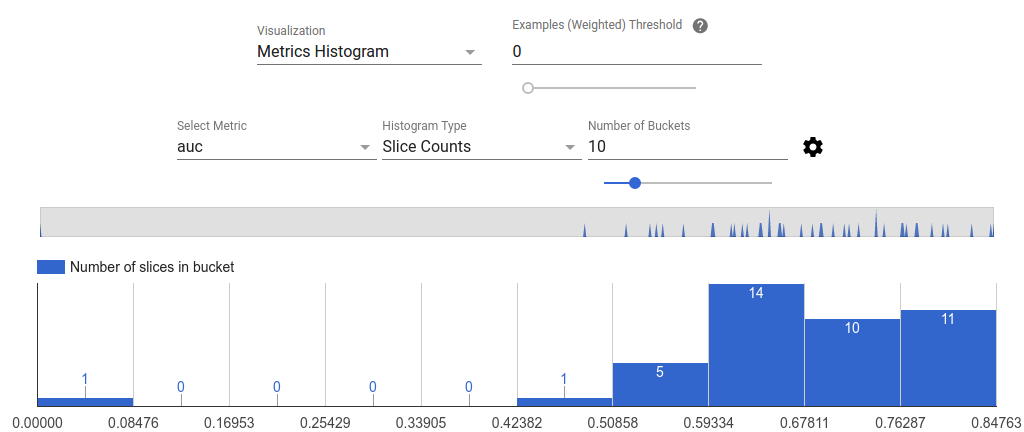
สามารถเปลี่ยนจำนวนที่เก็บข้อมูลและสเกลลอการิทึมได้ในเมนูการตั้งค่าโดยคลิกที่ไอคอนรูปเฟือง

นอกจากนี้ยังสามารถกรองค่าผิดปกติออกในมุมมองฮิสโตแกรมได้อีกด้วย เพียงลากช่วงที่ต้องการในฮิสโตแกรมดังที่แสดงในภาพหน้าจอด้านล่าง

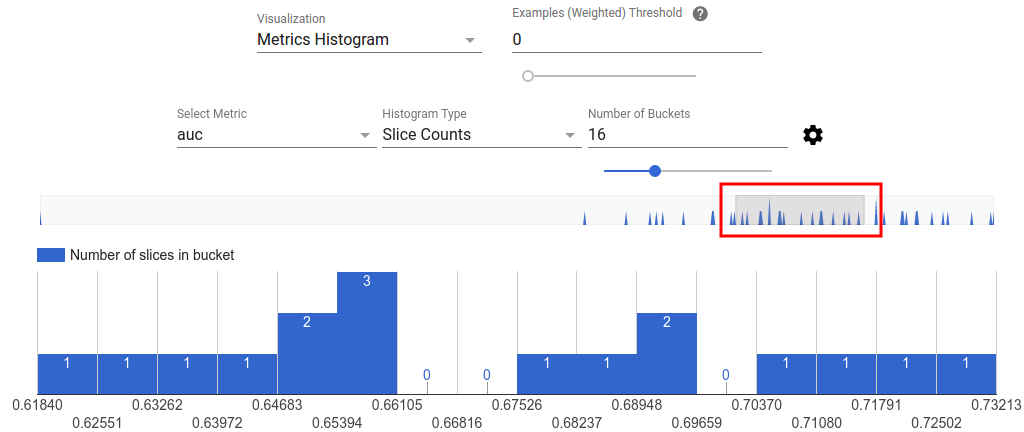
เมื่อจำนวนชิ้นมีขนาดใหญ่ นี่คือมุมมองเริ่มต้น
ตารางเมตริก
ตารางเมตริกจะสรุปผลลัพธ์สำหรับเมตริกทั้งหมดที่เลือกในตัวเลือกเมตริก สามารถจัดเรียงได้โดยคลิกที่ชื่อเมตริก เฉพาะส่วนที่ไม่ถูกกรองเท่านั้นที่จะแสดงผล
มุมมองพล็อต
แต่ละโครงเรื่องมีการแสดงภาพข้อมูลของตัวเองซึ่งเป็นเอกลักษณ์เฉพาะของโครงเรื่อง สำหรับข้อมูลเพิ่มเติม โปรดดูเอกสารประกอบ API ที่เกี่ยวข้องสำหรับคลาสพล็อต โปรดทราบว่าใน TFMA ทั้งแปลงและหน่วยเมตริกถูกกำหนดไว้ภายใต้ tfma.metrics.*
ตามแบบแผน คลาสที่เกี่ยวข้องกับการลงจุดสิ้นสุดใน Plot
หากต้องการดูพล็อต ให้ใช้ tfma.view.render_plot
API ผ่าน tfma.EvalResult
ที่เอาต์พุตจากการรันการประเมิน
กราฟอนุกรมเวลา
กราฟอนุกรมเวลาทำให้ง่ายต่อการมองเห็นแนวโน้มของหน่วยวัดเฉพาะในช่วงข้อมูลหรือการรันโมเดล หากต้องการสร้างกราฟอนุกรมเวลา ให้ทำการประเมินหลายครั้ง (บันทึกเอาต์พุตไปยังไดเร็กทอรีอื่น) จากนั้นโหลดลงในออบเจ็กต์ tfma.EvalResults
โดยการเรียก tfma.load_eval_results
ผลลัพธ์สามารถแสดงผลได้โดยใช้ tfma.view.render_time_series
หากต้องการแสดงกราฟสำหรับตัวชี้วัดเฉพาะ เพียงคลิกที่กราฟจากรายการแบบเลื่อนลง หากต้องการปิดกราฟ ให้คลิก X ที่มุมขวาบน

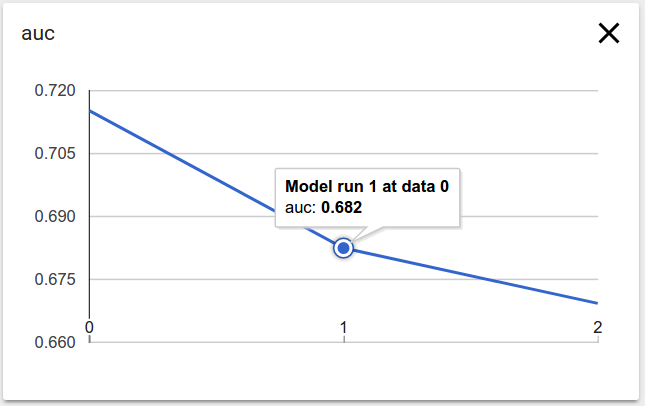
วางเมาส์เหนือจุดข้อมูลใดๆ ในกราฟจะแสดงคำแนะนำเครื่องมือที่ระบุการเรียกใช้โมเดล ช่วงข้อมูล และค่าเมตริก
เนื้อหาของหน้าเว็บนี้ได้รับอนุญาตภายใต้ใบอนุญาตที่ต้องระบุที่มาของครีเอทีฟคอมมอนส์ 4.0 และตัวอย่างโค้ดได้รับอนุญาตภายใต้ใบอนุญาต Apache 2.0 เว้นแต่จะระบุไว้เป็นอย่างอื่น โปรดดูรายละเอียดที่นโยบายเว็บไซต์ Google Developers Java เป็นเครื่องหมายการค้าจดทะเบียนของ Oracle และ/หรือบริษัทในเครือ
อัปเดตล่าสุด 2025-07-25 UTC
[null,null,["อัปเดตล่าสุด 2025-07-25 UTC"],[],[],null,["# TensorFlow Model Analysis Visualizations\n\n\u003cbr /\u003e\n\nThe output of running an evaluation is a\n[`tfma.EvalResult`](https://www.tensorflow.org/tfx/model_analysis/api_docs/python/tfma/EvalResult)\nwhich can be visualized in a Jupyter notebook by calling\n[`tfma.view.render_slicing_metrics`](https://www.tensorflow.org/tfx/model_analysis/api_docs/python/tfma/view/render_slicing_metrics)\n(or\n[`tfma.view.render_plot`](https://www.tensorflow.org/tfx/model_analysis/api_docs/python/tfma/view/render_plot)\nfor plots).\n\n### Metrics View\n\nTo view metrics, use the\n[`tfma.view.render_slicing_metrics`](https://www.tensorflow.org/tfx/model_analysis/api_docs/python/tfma/view/render_slicing_metrics)\nAPI passing the [`tfma.EvalResult`](https://www.tensorflow.org/tfx/model_analysis/api_docs/python/tfma/EvalResult) that was output from the evaluation run. The\nmetrics view is composed of three parts:\n\n- Metrics Selector\n\n By default, all computed metrics are displayed and the columns are sorted\n alphabetically. Metrics selector allows the user to add / remove / reorder\n metrics. Simply check / uncheck metrics from the dropdown (hold Ctrl for\n multi-select) or type / re-arrange them directly in the input box.\n\n- Metric Visualization\n\n Metric visualization aims to provide intuition about slices in the feature\n chosen. A quick filtering is available to filter out slices with small\n weighted sample count.\n\n Two type of visualizations are supported:\n 1. Slice overview\n\n In this view, value for the chosen metric is rendered for each slice and\n the slices can be sorted by the slice name or the value of another\n metric.\n\n When the number of slices are small, this is the default view.\n 2. Metrics Histogram\n\n In this view, slices are broken down into buckets based on their metric\n values. The value(s) displayed in each bucket can be the number of\n slices in the bucket or the total weighted sample count for all slices\n in the bucket or both.\n\n The number of buckets can be changed and logarithmic scale can be\n applied in the settings menu by clicking on the gear icon.\n\n It is also possible to filter out outliers in the histogram view. Simply\n drag the desired range in the histogram as shown in the screenshot\n below.\n\n When the number of slices are large, this is the default view.\n- Metrics Table\n\n The metric table summarizes results for all metrics chosen in metrics\n selector. It can be sorted by clicking on the metric name. Only slices not\n filtered out will be rendered.\n\n### Plot Views\n\nEach plot has it own visualization that is unique to the plot. For more\ninformation, see the relevant API documentation for the plot class. Note that\nin TFMA, plots and metrics are both defined under [`tfma.metrics.*`](https://www.tensorflow.org/tfx/model_analysis/api_docs/python/tfma/api/metrics)\nBy convention the classes related to plots end in `Plot`. To view plots, use the\n[`tfma.view.render_plot`](https://www.tensorflow.org/tfx/model_analysis/api_docs/python/tfma/view/render_plot)\nAPI passing the [`tfma.EvalResult`](https://www.tensorflow.org/tfx/model_analysis/api_docs/python/tfma/EvalResult) that was output from the evaluation run.\n\n### Time Series Graphs\n\nTime series graphs make it easy to spot trends of a specific metric over data\nspans or model runs. To create a time series graph, perform multiple evaluations\n(saving the output to different directories), and then load them into a\n`tfma.EvalResults` object by calling\n[`tfma.load_eval_results`](https://www.tensorflow.org/tfx/model_analysis/api_docs/python/tfma/api/load_eval_results).\nThe results can then be displayed using\n[`tfma.view.render_time_series`](https://www.tensorflow.org/tfx/model_analysis/api_docs/python/tfma/view/render_time_series)\n\nTo display the graph for a specific metric, simply click on it from the dropdown\nlist. To dismiss a graph, click on the X on the upper right corner.\n\nHover over any data point in the graph shows a tooltip indicating model run,\ndata span, and metric value."]]