הדמיית ניתוח מודל TensorFlow
קל לארגן דפים בעזרת אוספים
אפשר לשמור ולסווג תוכן על סמך ההעדפות שלך.
הפלט של הפעלת הערכה הוא tfma.EvalResult
שניתן להמחיש במחברת Jupyter על ידי קריאה ל- tfma.view.render_slicing_metrics
(או tfma.view.render_plot
עבור מגרשים).
תצוגת מדדים
כדי להציג מדדים, השתמש בממשק ה-API של tfma.view.render_slicing_metrics
המעביר את ה- tfma.EvalResult
שהוצא מהפעלת ההערכה. תצוגת המדדים מורכבת משלושה חלקים:
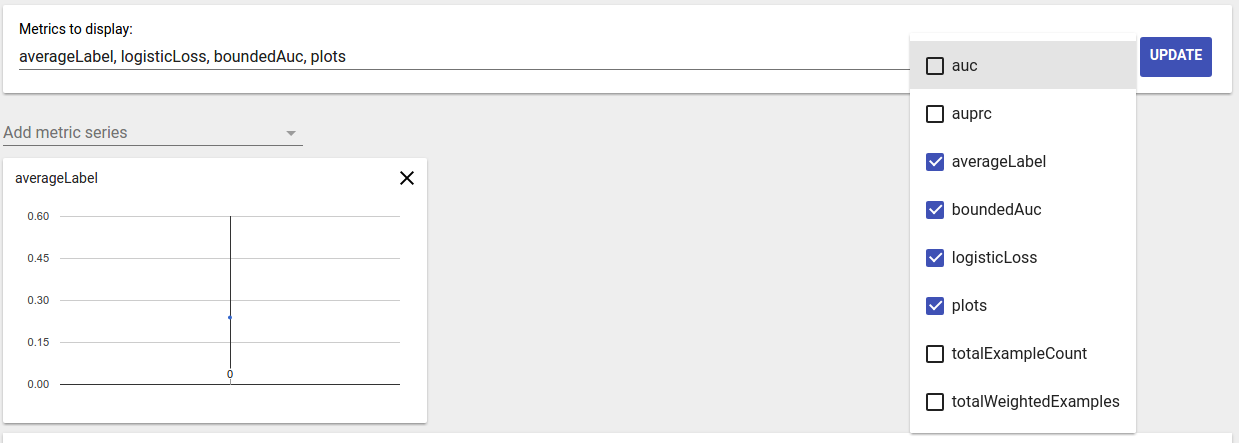
בורר מדדים
כברירת מחדל, כל המדדים המחושבים מוצגים והעמודות ממוינות בסדר אלפביתי. בורר מדדים מאפשר למשתמש להוסיף / להסיר / לסדר מחדש מדדים. פשוט סמן/בטל את הסימון של מדדים מהתפריט הנפתח (החזק את Ctrl לבחירה מרובה) או הקלד/ארגן אותם מחדש ישירות בתיבת הקלט.

ויזואליזציה מטרית
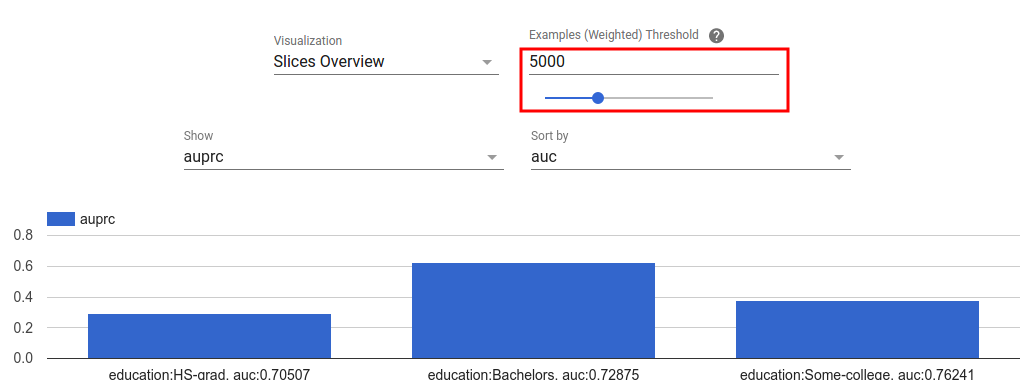
ויזואליזציה מטרית שואפת לספק אינטואיציה לגבי פרוסות בתכונה שנבחרה. סינון מהיר זמין לסינון פרוסות עם ספירת דגימות משוקללת קטנה.

שני סוגים של הדמיות נתמכות:
סקירת פרוסה
בתצוגה זו, הערך עבור המדד הנבחר מוצג עבור כל פרוסה וניתן למיין את הפרוסות לפי שם הפרוסה או הערך של מדד אחר.

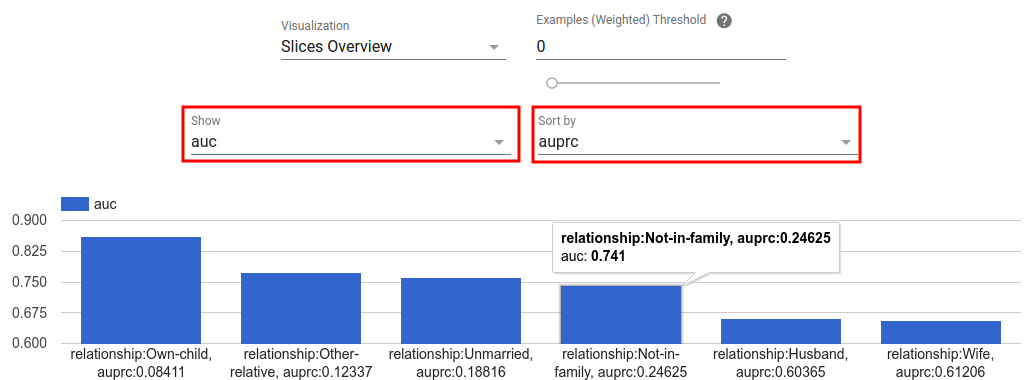
כאשר מספר הפרוסות קטן, זוהי תצוגת ברירת המחדל.
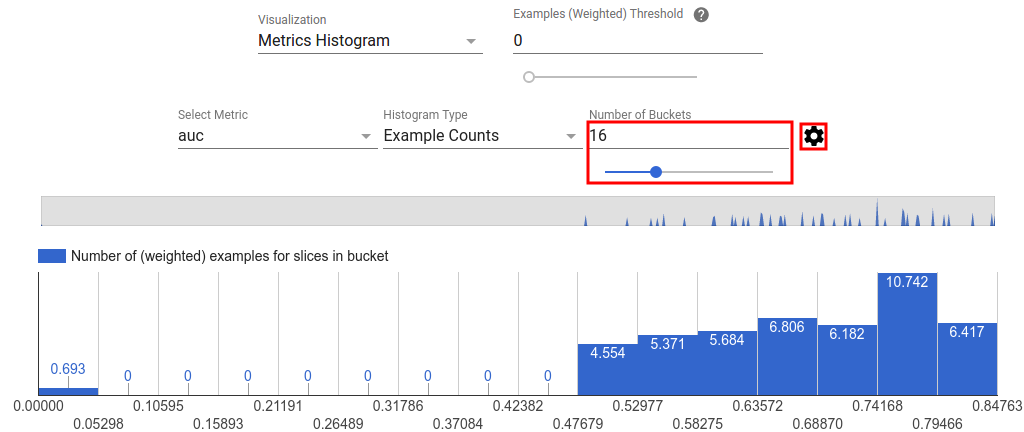
היסטוגרמה של מדדים
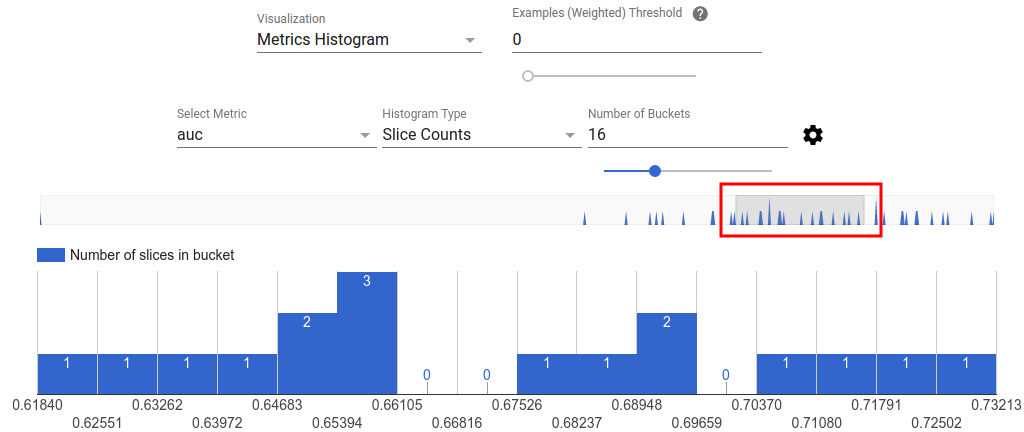
בתצוגה זו, פרוסות מחולקות לקטגוריות בהתבסס על הערכים המטריים שלהן. הערכים המוצגים בכל דלי יכולים להיות מספר הפרוסות בדלי או ספירת הדגימה המשוקללת הכוללת עבור כל הפרוסות בדלי או שניהם.

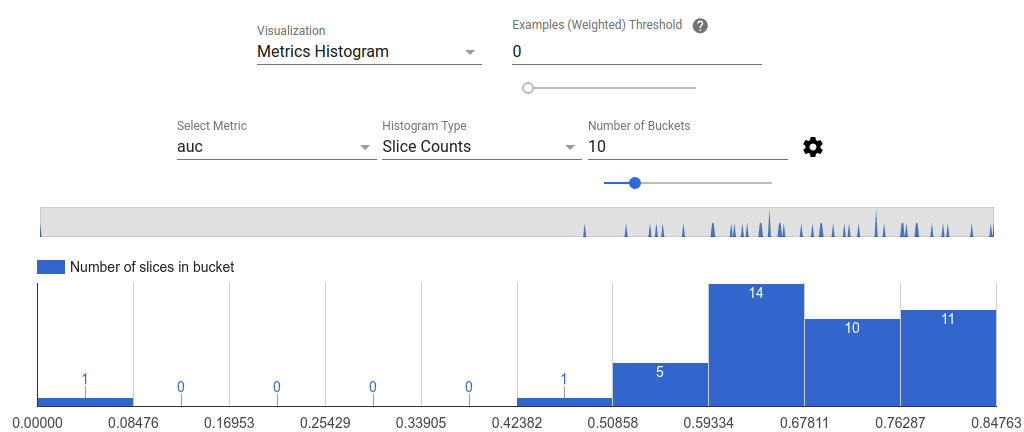
ניתן לשנות את מספר הדליים ולהחיל קנה מידה לוגריתמי בתפריט ההגדרות על ידי לחיצה על סמל גלגל השיניים.

אפשר גם לסנן חריגים בתצוגת ההיסטוגרמה. פשוט גרור את הטווח הרצוי בהיסטוגרמה כפי שמוצג בצילום המסך למטה.

כאשר מספר הפרוסות גדול, זוהי תצוגת ברירת המחדל.
טבלת מדדים
טבלת המדדים מסכמת את התוצאות עבור כל המדדים שנבחרו בבורר המדדים. ניתן למיין אותו על ידי לחיצה על שם המדד. רק פרוסות שלא סוננו יעובדו.
תצוגות עלילה
לכל עלילה יש הדמיה משלה הייחודית לעלילה. למידע נוסף, עיין בתיעוד ה-API הרלוונטי למחלקת העלילה. שימו לב שב-TFMA, מגרשים ומדדים מוגדרים שניהם תחת tfma.metrics.*
על פי המוסכמה, המחלקות הקשורות לחלקות מסתיימות ב- Plot
. כדי להציג חלקות, השתמש בממשק ה-API tfma.view.render_plot
המעביר את tfma.EvalResult
שהוצא מהפעלת ההערכה.
גרפים של סדרות זמן
גרפים של סדרות זמן מקלים על זיהוי מגמות של מדד מסוים על פני טווחי נתונים או ריצות מודל. כדי ליצור גרף סדרת זמן, בצע הערכות מרובות (שמירת הפלט בספריות שונות), ולאחר מכן טען אותן לאובייקט tfma.EvalResults
על ידי קריאה tfma.load_eval_results
. לאחר מכן ניתן להציג את התוצאות באמצעות tfma.view.render_time_series
כדי להציג את הגרף עבור מדד מסוים, פשוט לחץ עליו מהרשימה הנפתחת. כדי לסגור גרף, לחץ על ה-X בפינה השמאלית העליונה.

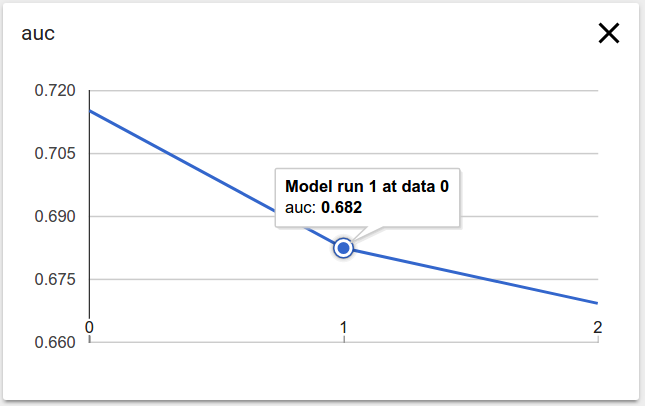
רחף מעל כל נקודת נתונים בתרשים מציג תיאור כלים המציין את הפעלת המודל, טווח הנתונים וערך המדדים.
אלא אם צוין אחרת, התוכן של דף זה הוא ברישיון Creative Commons Attribution 4.0 ודוגמאות הקוד הן ברישיון Apache 2.0. לפרטים, ניתן לעיין במדיניות האתר Google Developers. Java הוא סימן מסחרי רשום של חברת Oracle ו/או של השותפים העצמאיים שלה.
עדכון אחרון: 2025-07-25 (שעון UTC).
[null,null,["עדכון אחרון: 2025-07-25 (שעון UTC)."],[],[],null,["# TensorFlow Model Analysis Visualizations\n\n\u003cbr /\u003e\n\nThe output of running an evaluation is a\n[`tfma.EvalResult`](https://www.tensorflow.org/tfx/model_analysis/api_docs/python/tfma/EvalResult)\nwhich can be visualized in a Jupyter notebook by calling\n[`tfma.view.render_slicing_metrics`](https://www.tensorflow.org/tfx/model_analysis/api_docs/python/tfma/view/render_slicing_metrics)\n(or\n[`tfma.view.render_plot`](https://www.tensorflow.org/tfx/model_analysis/api_docs/python/tfma/view/render_plot)\nfor plots).\n\n### Metrics View\n\nTo view metrics, use the\n[`tfma.view.render_slicing_metrics`](https://www.tensorflow.org/tfx/model_analysis/api_docs/python/tfma/view/render_slicing_metrics)\nAPI passing the [`tfma.EvalResult`](https://www.tensorflow.org/tfx/model_analysis/api_docs/python/tfma/EvalResult) that was output from the evaluation run. The\nmetrics view is composed of three parts:\n\n- Metrics Selector\n\n By default, all computed metrics are displayed and the columns are sorted\n alphabetically. Metrics selector allows the user to add / remove / reorder\n metrics. Simply check / uncheck metrics from the dropdown (hold Ctrl for\n multi-select) or type / re-arrange them directly in the input box.\n\n- Metric Visualization\n\n Metric visualization aims to provide intuition about slices in the feature\n chosen. A quick filtering is available to filter out slices with small\n weighted sample count.\n\n Two type of visualizations are supported:\n 1. Slice overview\n\n In this view, value for the chosen metric is rendered for each slice and\n the slices can be sorted by the slice name or the value of another\n metric.\n\n When the number of slices are small, this is the default view.\n 2. Metrics Histogram\n\n In this view, slices are broken down into buckets based on their metric\n values. The value(s) displayed in each bucket can be the number of\n slices in the bucket or the total weighted sample count for all slices\n in the bucket or both.\n\n The number of buckets can be changed and logarithmic scale can be\n applied in the settings menu by clicking on the gear icon.\n\n It is also possible to filter out outliers in the histogram view. Simply\n drag the desired range in the histogram as shown in the screenshot\n below.\n\n When the number of slices are large, this is the default view.\n- Metrics Table\n\n The metric table summarizes results for all metrics chosen in metrics\n selector. It can be sorted by clicking on the metric name. Only slices not\n filtered out will be rendered.\n\n### Plot Views\n\nEach plot has it own visualization that is unique to the plot. For more\ninformation, see the relevant API documentation for the plot class. Note that\nin TFMA, plots and metrics are both defined under [`tfma.metrics.*`](https://www.tensorflow.org/tfx/model_analysis/api_docs/python/tfma/api/metrics)\nBy convention the classes related to plots end in `Plot`. To view plots, use the\n[`tfma.view.render_plot`](https://www.tensorflow.org/tfx/model_analysis/api_docs/python/tfma/view/render_plot)\nAPI passing the [`tfma.EvalResult`](https://www.tensorflow.org/tfx/model_analysis/api_docs/python/tfma/EvalResult) that was output from the evaluation run.\n\n### Time Series Graphs\n\nTime series graphs make it easy to spot trends of a specific metric over data\nspans or model runs. To create a time series graph, perform multiple evaluations\n(saving the output to different directories), and then load them into a\n`tfma.EvalResults` object by calling\n[`tfma.load_eval_results`](https://www.tensorflow.org/tfx/model_analysis/api_docs/python/tfma/api/load_eval_results).\nThe results can then be displayed using\n[`tfma.view.render_time_series`](https://www.tensorflow.org/tfx/model_analysis/api_docs/python/tfma/view/render_time_series)\n\nTo display the graph for a specific metric, simply click on it from the dropdown\nlist. To dismiss a graph, click on the X on the upper right corner.\n\nHover over any data point in the graph shows a tooltip indicating model run,\ndata span, and metric value."]]