تصورات تحليل نموذج TensorFlow
تنظيم صفحاتك في مجموعات
يمكنك حفظ المحتوى وتصنيفه حسب إعداداتك المفضّلة.
مخرجات تشغيل التقييم هي tfma.EvalResult
والتي يمكن تصورها في دفتر Jupyter عن طريق استدعاء tfma.view.render_slicing_metrics
(أو tfma.view.render_plot
للمخططات).
عرض المقاييس
لعرض المقاييس، استخدم tfma.view.render_slicing_metrics
API لتمرير tfma.EvalResult
الذي تم إخراجه من تشغيل التقييم. يتكون عرض المقاييس من ثلاثة أجزاء:
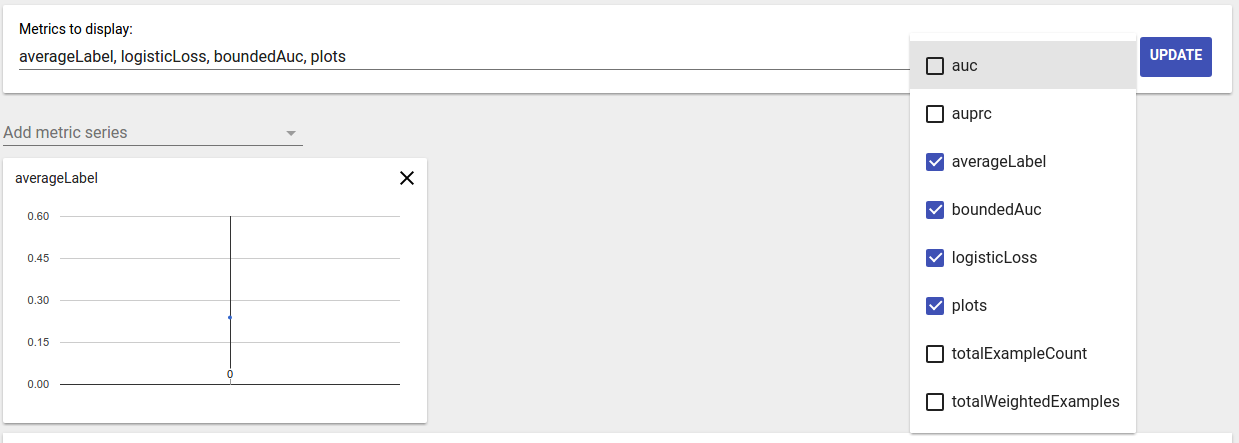
محدد المقاييس
افتراضيًا، يتم عرض كافة المقاييس المحسوبة ويتم فرز الأعمدة أبجديًا. يسمح محدد المقاييس للمستخدم بإضافة / إزالة / إعادة ترتيب المقاييس. ما عليك سوى تحديد/إلغاء تحديد المقاييس من القائمة المنسدلة (اضغط باستمرار على Ctrl للتحديد المتعدد) أو كتابتها/إعادة ترتيبها مباشرةً في مربع الإدخال.

التصور المتري
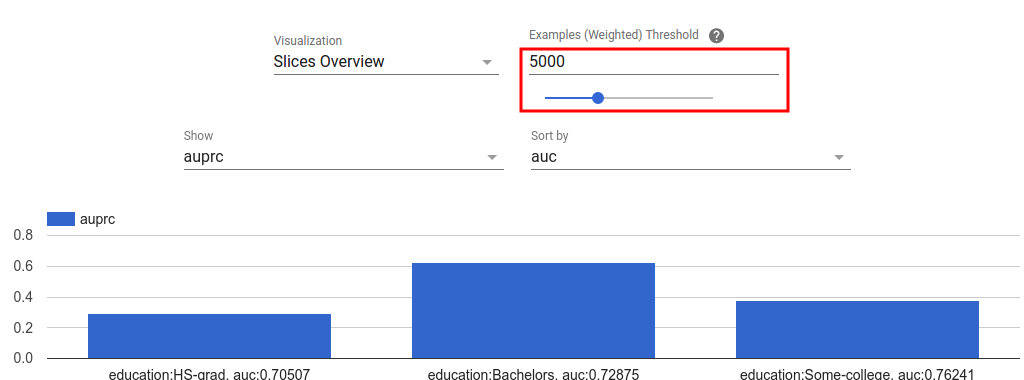
يهدف التصور المتري إلى توفير فكرة واضحة عن الشرائح في الميزة المختارة. تتوفر تصفية سريعة لتصفية الشرائح ذات عدد العينات الصغيرة الموزونة.

يتم دعم نوعين من المرئيات:
نظرة عامة على الشريحة
في طريقة العرض هذه، يتم عرض قيمة المقياس المختار لكل شريحة ويمكن فرز الشرائح حسب اسم الشريحة أو قيمة مقياس آخر.

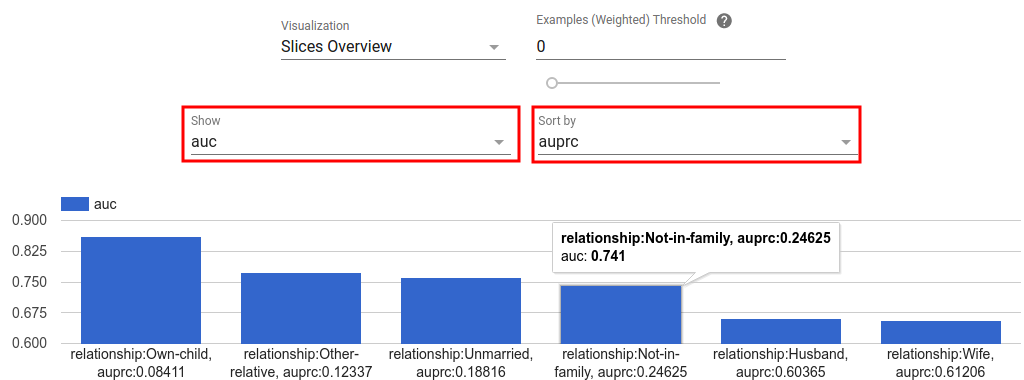
عندما يكون عدد الشرائح صغيرًا، يكون هذا هو العرض الافتراضي.
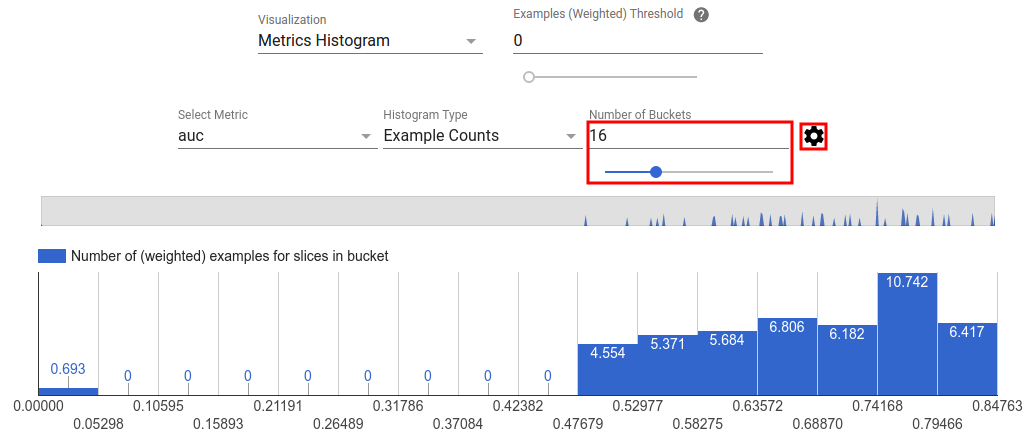
المقاييس الرسم البياني
في طريقة العرض هذه، يتم تقسيم الشرائح إلى مجموعات بناءً على قيم القياس الخاصة بها. يمكن أن تكون القيمة (القيم) المعروضة في كل مجموعة هي عدد الشرائح في المجموعة أو إجمالي عدد العينات المرجحة لجميع الشرائح في المجموعة أو كليهما.

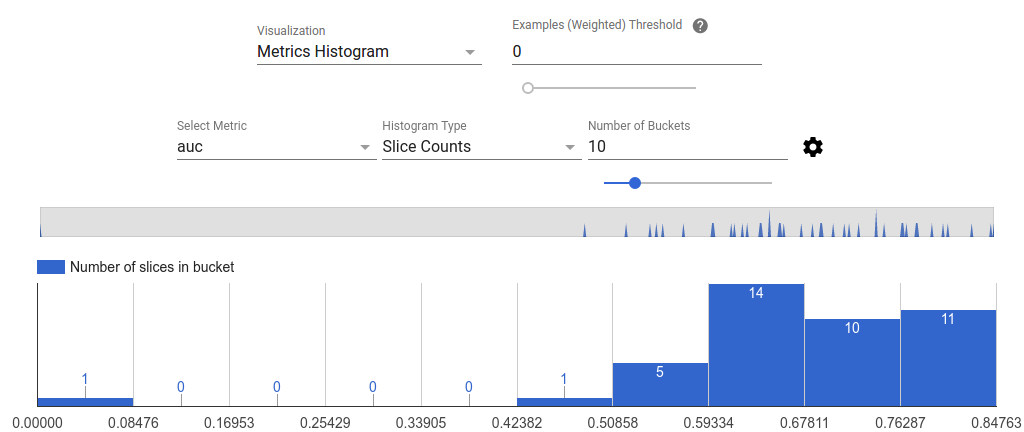
يمكن تغيير عدد المجموعات وتطبيق المقياس اللوغاريتمي في قائمة الإعدادات من خلال النقر على أيقونة الترس.

من الممكن أيضًا تصفية القيم المتطرفة في عرض الرسم البياني. ما عليك سوى سحب النطاق المطلوب في الرسم البياني كما هو موضح في لقطة الشاشة أدناه.

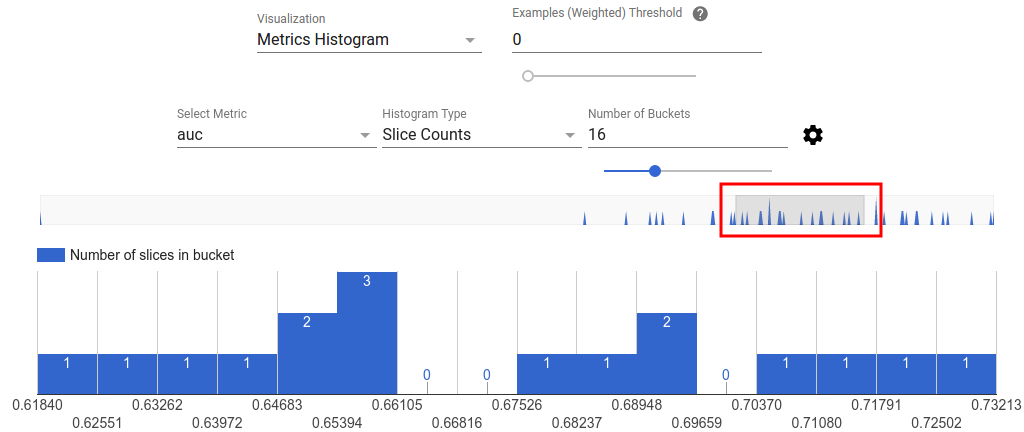
عندما يكون عدد الشرائح كبيرًا، يكون هذا هو العرض الافتراضي.
جدول المقاييس
يلخص جدول المقاييس النتائج لجميع المقاييس المختارة في محدد المقاييس. ويمكن فرزها من خلال النقر على اسم المقياس. سيتم عرض الشرائح التي لم تتم تصفيتها فقط.
مشاهدات المؤامرة
كل قطعة لها تصور خاص بها فريد من نوعه في الحبكة. لمزيد من المعلومات، راجع وثائق API ذات الصلة لفئة الرسم. لاحظ أنه في TFMA، يتم تعريف كل من المخططات والمقاييس ضمن tfma.metrics.*
وفقًا للاتفاقية، تنتهي الفئات المتعلقة بالمخططات في Plot
. لعرض المخططات، استخدم tfma.view.render_plot
API لتمرير tfma.EvalResult
الذي تم إخراجه من تشغيل التقييم.
الرسوم البيانية للسلاسل الزمنية
تسهل الرسوم البيانية للسلاسل الزمنية اكتشاف اتجاهات مقياس معين عبر امتدادات البيانات أو تشغيل النماذج. لإنشاء رسم بياني لسلسلة زمنية، قم بإجراء تقييمات متعددة (احفظ المخرجات في أدلة مختلفة)، ثم قم بتحميلها إلى كائن tfma.EvalResults
عن طريق استدعاء tfma.load_eval_results
. ويمكن بعد ذلك عرض النتائج باستخدام tfma.view.render_time_series
لعرض الرسم البياني لمقياس معين، ما عليك سوى النقر عليه من القائمة المنسدلة. لتجاهل رسم بياني، انقر على X في الزاوية اليمنى العليا.

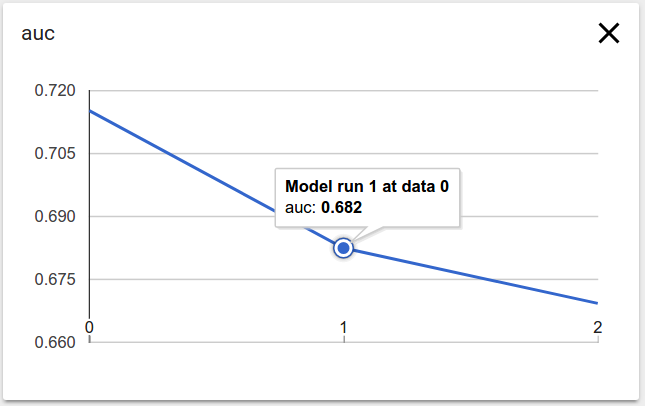
يؤدي التمرير فوق أي نقطة بيانات في الرسم البياني إلى إظهار تلميح أداة يشير إلى تشغيل النموذج ونطاق البيانات وقيمة المقياس.
إنّ محتوى هذه الصفحة مرخّص بموجب ترخيص Creative Commons Attribution 4.0 ما لم يُنصّ على خلاف ذلك، ونماذج الرموز مرخّصة بموجب ترخيص Apache 2.0. للاطّلاع على التفاصيل، يُرجى مراجعة سياسات موقع Google Developers. إنّ Java هي علامة تجارية مسجَّلة لشركة Oracle و/أو شركائها التابعين.
تاريخ التعديل الأخير: 2025-07-25 (حسب التوقيت العالمي المتفَّق عليه)
[null,null,["تاريخ التعديل الأخير: 2025-07-25 (حسب التوقيت العالمي المتفَّق عليه)"],[],[],null,["# TensorFlow Model Analysis Visualizations\n\n\u003cbr /\u003e\n\nThe output of running an evaluation is a\n[`tfma.EvalResult`](https://www.tensorflow.org/tfx/model_analysis/api_docs/python/tfma/EvalResult)\nwhich can be visualized in a Jupyter notebook by calling\n[`tfma.view.render_slicing_metrics`](https://www.tensorflow.org/tfx/model_analysis/api_docs/python/tfma/view/render_slicing_metrics)\n(or\n[`tfma.view.render_plot`](https://www.tensorflow.org/tfx/model_analysis/api_docs/python/tfma/view/render_plot)\nfor plots).\n\n### Metrics View\n\nTo view metrics, use the\n[`tfma.view.render_slicing_metrics`](https://www.tensorflow.org/tfx/model_analysis/api_docs/python/tfma/view/render_slicing_metrics)\nAPI passing the [`tfma.EvalResult`](https://www.tensorflow.org/tfx/model_analysis/api_docs/python/tfma/EvalResult) that was output from the evaluation run. The\nmetrics view is composed of three parts:\n\n- Metrics Selector\n\n By default, all computed metrics are displayed and the columns are sorted\n alphabetically. Metrics selector allows the user to add / remove / reorder\n metrics. Simply check / uncheck metrics from the dropdown (hold Ctrl for\n multi-select) or type / re-arrange them directly in the input box.\n\n- Metric Visualization\n\n Metric visualization aims to provide intuition about slices in the feature\n chosen. A quick filtering is available to filter out slices with small\n weighted sample count.\n\n Two type of visualizations are supported:\n 1. Slice overview\n\n In this view, value for the chosen metric is rendered for each slice and\n the slices can be sorted by the slice name or the value of another\n metric.\n\n When the number of slices are small, this is the default view.\n 2. Metrics Histogram\n\n In this view, slices are broken down into buckets based on their metric\n values. The value(s) displayed in each bucket can be the number of\n slices in the bucket or the total weighted sample count for all slices\n in the bucket or both.\n\n The number of buckets can be changed and logarithmic scale can be\n applied in the settings menu by clicking on the gear icon.\n\n It is also possible to filter out outliers in the histogram view. Simply\n drag the desired range in the histogram as shown in the screenshot\n below.\n\n When the number of slices are large, this is the default view.\n- Metrics Table\n\n The metric table summarizes results for all metrics chosen in metrics\n selector. It can be sorted by clicking on the metric name. Only slices not\n filtered out will be rendered.\n\n### Plot Views\n\nEach plot has it own visualization that is unique to the plot. For more\ninformation, see the relevant API documentation for the plot class. Note that\nin TFMA, plots and metrics are both defined under [`tfma.metrics.*`](https://www.tensorflow.org/tfx/model_analysis/api_docs/python/tfma/api/metrics)\nBy convention the classes related to plots end in `Plot`. To view plots, use the\n[`tfma.view.render_plot`](https://www.tensorflow.org/tfx/model_analysis/api_docs/python/tfma/view/render_plot)\nAPI passing the [`tfma.EvalResult`](https://www.tensorflow.org/tfx/model_analysis/api_docs/python/tfma/EvalResult) that was output from the evaluation run.\n\n### Time Series Graphs\n\nTime series graphs make it easy to spot trends of a specific metric over data\nspans or model runs. To create a time series graph, perform multiple evaluations\n(saving the output to different directories), and then load them into a\n`tfma.EvalResults` object by calling\n[`tfma.load_eval_results`](https://www.tensorflow.org/tfx/model_analysis/api_docs/python/tfma/api/load_eval_results).\nThe results can then be displayed using\n[`tfma.view.render_time_series`](https://www.tensorflow.org/tfx/model_analysis/api_docs/python/tfma/view/render_time_series)\n\nTo display the graph for a specific metric, simply click on it from the dropdown\nlist. To dismiss a graph, click on the X on the upper right corner.\n\nHover over any data point in the graph shows a tooltip indicating model run,\ndata span, and metric value."]]