
| | |  GitHub'da görüntüle GitHub'da görüntüle | |
Arka plan
Bu not defteri, bir Jupyter/Colab ortamında scikit-learn modeliyle Model Kart Araç Takımı kullanılarak bir model kartın nasıl oluşturulacağını gösterir. En modeli kartlarıyla ilgili daha fazla bilgi edinebilirsiniz https://modelcards.withgoogle.com/about .
Kurmak
Öncelikle gerekli paketleri kurup import etmemiz gerekiyor.
Pip 20.2'ye Yükseltin ve Paketleri Kurun
pip install -q --upgrade pip==20.2pip install -q -U seaborn scikit-learn model-card-toolkit
Çalışma zamanını yeniden başlattınız mı?
Google Colab kullanıyorsanız, yukarıdaki hücreyi ilk kez çalıştırdığınızda, çalışma zamanını yeniden başlatmanız gerekir (Çalışma Zamanı > Çalışma zamanını yeniden başlat...).
Paketleri içe aktar
Scikit-learn dahil gerekli paketleri içe aktarıyoruz.
from datetime import date
from io import BytesIO
from IPython import display
from model_card_toolkit import ModelCardToolkit
from sklearn.datasets import load_breast_cancer
from sklearn.ensemble import GradientBoostingClassifier
from sklearn.model_selection import train_test_split
from sklearn.metrics import plot_roc_curve, plot_confusion_matrix

import base64
import matplotlib.pyplot as plt
import pandas as pd
import seaborn as sns
import uuid
Veri yükle
Bu örnek kullanarak yükleyebilirsiniz scikit-öğrendikleri Meme Kanseri Wisconsin Teşhis veri kümesini kullanan load_breast_cancer () fonksiyonu.
cancer = load_breast_cancer()

X = pd.DataFrame(cancer.data, columns=cancer.feature_names)
y = pd.Series(cancer.target)

X_train, X_test, y_train, y_test = train_test_split(X, y)
X_train.head()
y_train.head()
28     0
157    1
381    1
436    1
71     1
dtype: int64
arsa verileri
Model kartına dahil edeceğimiz verilerden birkaç grafik oluşturacağız.
# Utility function that will export a plot to a base-64 encoded string that the model card will accept.

def plot_to_str():
    img = BytesIO()
    plt.savefig(img, format='png')
    return base64.encodebytes(img.getvalue()).decode('utf-8')
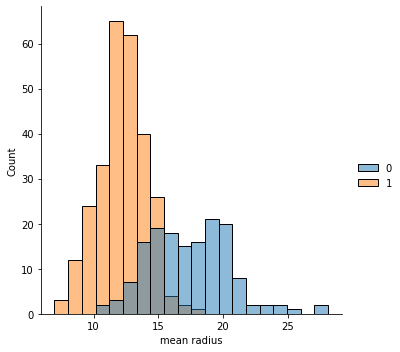
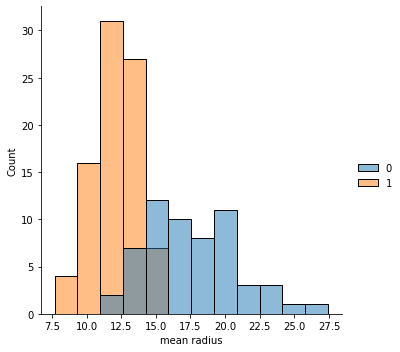
# Plot the mean radius feature for both the train and test sets

sns.displot(x=X_train['mean radius'], hue=y_train)
mean_radius_train = plot_to_str()

sns.displot(x=X_test['mean radius'], hue=y_test)
mean_radius_test = plot_to_str()
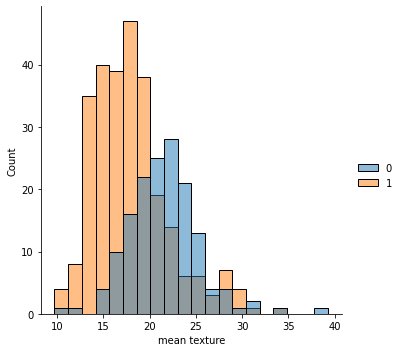
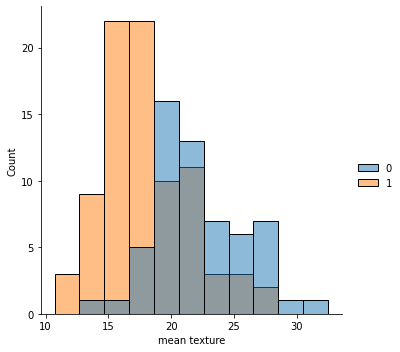
# Plot the mean texture feature for both the train and test sets

sns.displot(x=X_train['mean texture'], hue=y_train)
mean_texture_train = plot_to_str()

sns.displot(x=X_test['mean texture'], hue=y_test)
mean_texture_test = plot_to_str()
tren modeli
# Create a classifier and fit the training data

clf = GradientBoostingClassifier().fit(X_train, y_train)
Modeli değerlendir
# Plot a ROC curve

plot_roc_curve(clf, X_test, y_test)
roc_curve = plot_to_str()

# Plot a confusion matrix

plot_confusion_matrix(clf, X_test, y_test)
confusion_matrix = plot_to_str()

Bir model kartı oluşturun
Araç setini ve model kartını başlat
mct = ModelCardToolkit()

model_card = mct.scaffold_assets()
Bilgileri model kartına açıklama
model_card.model_details.name = 'Breast Cancer Wisconsin (Diagnostic) Dataset'
model_card.model_details.overview = (
    'This model predicts whether breast cancer is benign or malignant based on '
    'image measurements.')
model_card.model_details.owners = [
    {'name': 'Model Cards Team', 'contact': 'model-cards@google.com'}
]
model_card.model_details.references = [
    'https://archive.ics.uci.edu/ml/datasets/Breast+Cancer+Wisconsin+(Diagnostic)',
    'https://minds.wisconsin.edu/bitstream/handle/1793/59692/TR1131.pdf'
]
model_card.model_details.version.name = str(uuid.uuid4())
model_card.model_details.version.date = str(date.today())

model_card.considerations.ethical_considerations = [{
    'name': ('Manual selection of image sections to digitize could create '
            'selection bias'),
    'mitigation_strategy': 'Automate the selection process'
}]
model_card.considerations.limitations = ['Breast cancer diagnosis']
model_card.considerations.use_cases = ['Breast cancer diagnosis']
model_card.considerations.users = ['Medical professionals', 'ML researchers']


model_card.model_parameters.data.train.graphics.description = (
  f'{len(X_train)} rows with {len(X_train.columns)} features')
model_card.model_parameters.data.train.graphics.collection = [
    {'image': mean_radius_train},
    {'image': mean_texture_train}
]
model_card.model_parameters.data.eval.graphics.description = (
  f'{len(X_test)} rows with {len(X_test.columns)} features')
model_card.model_parameters.data.eval.graphics.collection = [
    {'image': mean_radius_test},
    {'image': mean_texture_test}
]
model_card.quantitative_analysis.graphics.description = (
  'ROC curve and confusion matrix')
model_card.quantitative_analysis.graphics.collection = [
    {'image': roc_curve},
    {'image': confusion_matrix}
]

mct.update_model_card_json(model_card)
Model kartı oluştur
# Return the model card document as an HTML page

html = mct.export_format()

display.display(display.HTML(html))